Business Intelligence Reporting
Introduction
Business Intelligence reporting is a chargeable plugin to CRM, with which you can analyze your CRM data from multiple perspectives even more thoroughly than with the default reporting features. The CRM-service BI reporting is based on the market’s leading BI technology QlikSense.
With BI, you can report the following modules and features and the modules linked to them (e.g. accounts, contacts, products etc.):
- Activities.
- Contact Center.
- HelpDesk.
- Expenses.
- Invoices.
- Sales Orders.
- Surveys.
- Potentials.
- Projects.
- Quotes.
Business Intelligence reports can be accessed from the CRM main menu, similarly to all the modules.
Common Features
There are several report types but they all have a few common features that work the same way for each report. These include the actions in the toolbar, quick filters and bookmarks.
Toolbar
The toolbar at the top of the report offers actions for managing the report. There are the following buttons on the left-hand side:
 The Smart search button can be used to search for a specific filtering factor; e.g. by searching by a user name, you can quickly create a filter that shows only the entities assigned to that user.
 The Step back and Step forward buttons are used to undo or redo the previous selection.
 The Clear all selections button clears all the selections and filters made.
After these buttons, the toolbar shows the selections made for the report that filter the view. For instance in the picture below, the report shows information concerning the year 2019. You can delete a single selection by clicking the delete button on the selection.
![]()
On the right-hand side of the toolbar there is a Selections button, which opens a view showing all the factors that can be used to adjust the report. In this view, you can make all the wanted filters at once.
Quick Filters
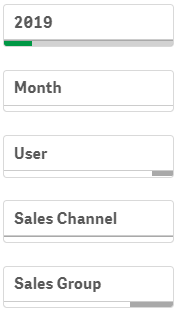
On the left-hand side of the reports, there are selections which you can use to quickly make most typical filters by time and possibly by user, sales channel and/or sales group (see the picture below). The available quick filters vary by the reported module and report type.
Bookmarks
The filters you create for the report are always temporary and they disappear if you leave the view or reload it. However, you can save the selections you use the most as bookmarks. The bookmarks are visible for all the users who can access the BI reports, but you can only delete bookmarks you have created yourself. All the bookmarks are available for all the reports – not only the one it was originally created for. Therefore it is recommended to pay attention to naming the bookmark properly.
You can start creating a new bookmark by first making all the selections you wish to save and then clicking the Bookmark button ![]() located either on the left- or right-hand side of the report.
located either on the left- or right-hand side of the report.
The button opens a popup (see the picture below). The view shows first the bookmarks made by you, and by clicking All bookmarks, you can also see all the other bookmarks created by other users. If there are lots of bookmarks, you can search for a specific one with the search field.
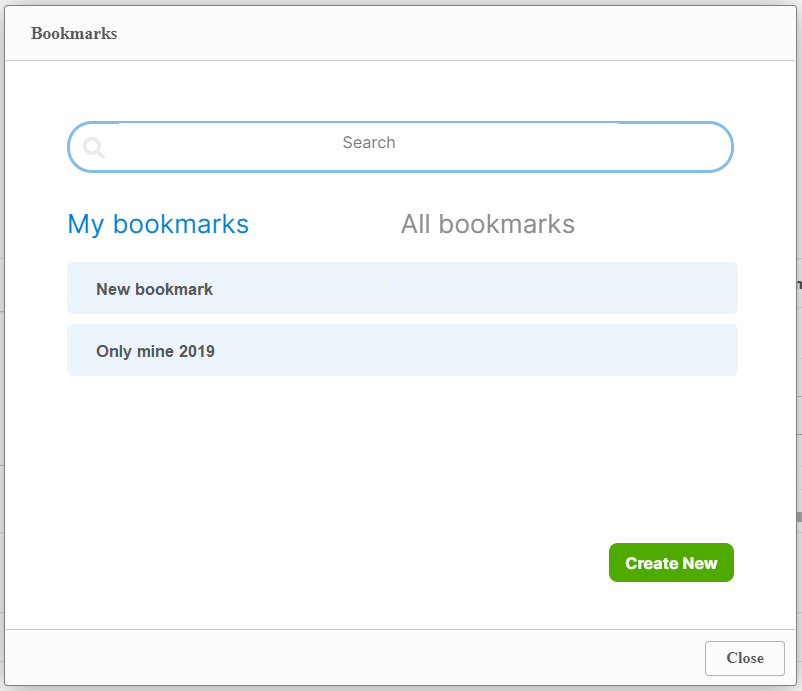
You can create a new bookmark by clicking the Create New button at the bottom right corner. The new bookmark requires a name and you can also provide a description.
You can delete a bookmark you have created yourself by selecting it and clicking the Remove button that appears at the bottom left corner.