General
With the sales funnel, for example, offers can be displayed according to their stages in the sales funnel. A sales funnel can be created on the front page and thereby shared with others in the reporting group. Additional instructions on front page. This guide goes through the different settings and definitions of the funnel.
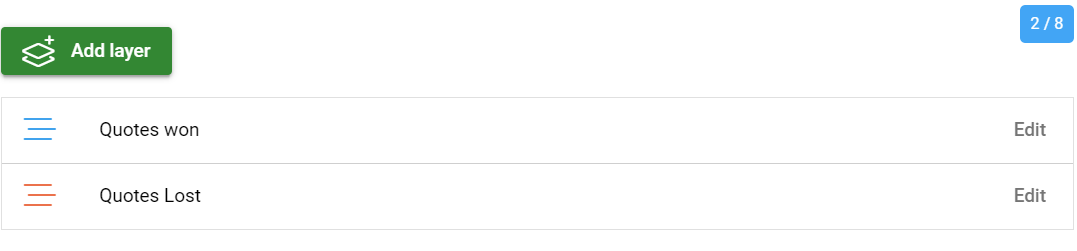
The funnel consists of layers, which can be 8 in total. The settings of each layer include basic information, visualization and conditions.
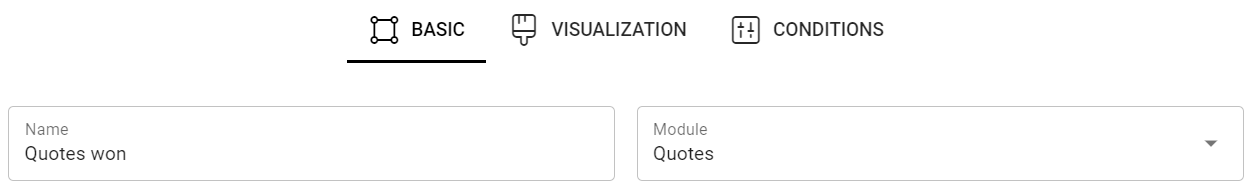
For basic information, select the module from which you want to take information. The name appears next to the finished funnel.
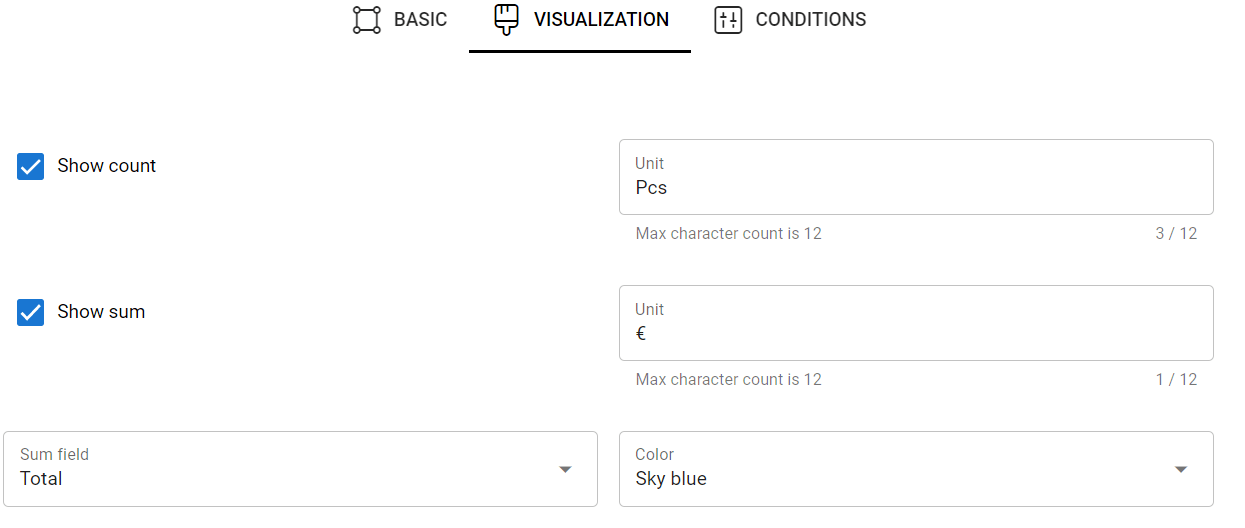
In the visualization, you can choose whether to display the amount, sum and in which units you want to display them. In the Sum field, you can select a subtotal or a total. You can also change the color of the layer on the funnel, so it is easier to separate the layers in the finished funnel.
Terms
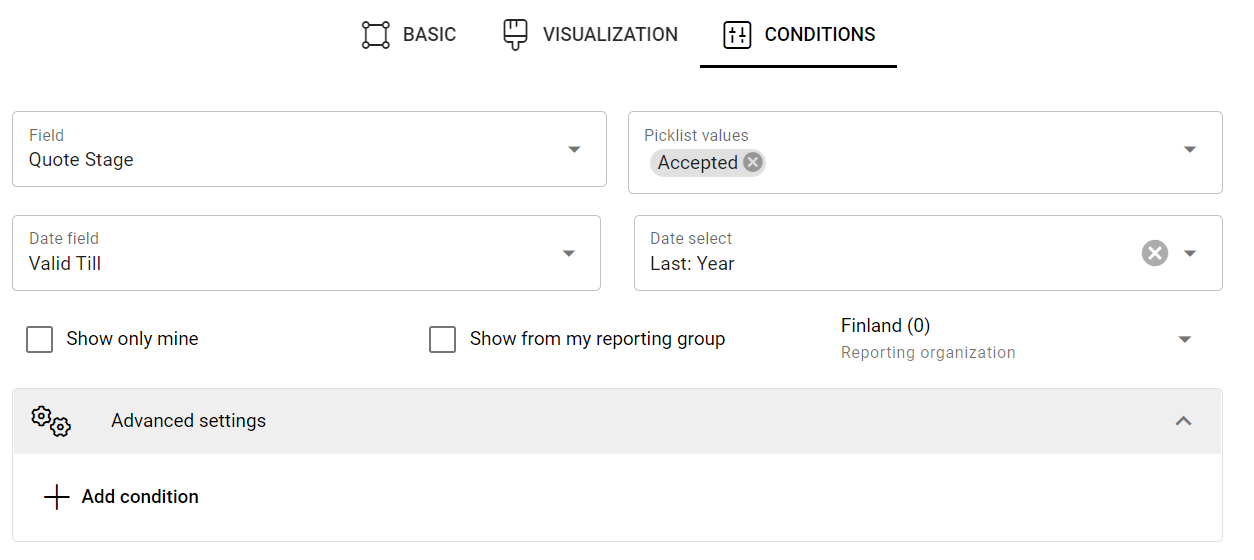
For the conditions, you can select a picklist field from the module according to which the information is displayed. In this example, the stage of the quote was taken as the field and the value won. This way, the number and amount of quotes that have been won are displayed in the funnel. In the terms, you can also choose the time range Current, Previous, Next Day/Week (Mon-Sun)/Month/Quarter/Year. In the terms, you can also choose whether to display only your own quotes or the quotes of the reporting group. In advanced settings, you can still define individual conditions where all fields of the module are used. You can have as many advanced conditions as you like.
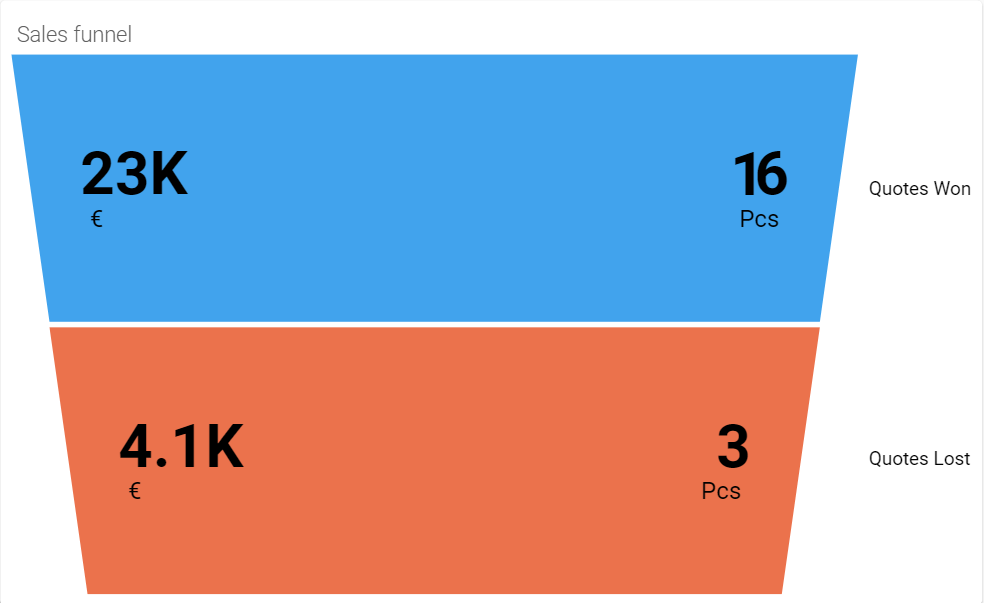
Finished funnel displaying Quotes won and lost.