General
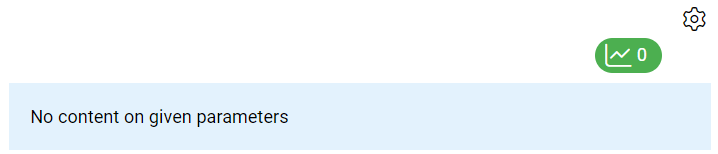
Charts are a useful reporting tool which can be used to represent data in visual form. By using the CRM2 layout settings, admin users can now add charts to the entity cards of the wanted module. When an entity chart is activated for the module in the settings, it will be visible in all the entity cards of this module. The entities’ charts are created the same way as homepage charts. If the chart has been enabled in the CRM2 layout settings but has not yet been configured, a placeholder will be shown in its place (see picture below).
Start
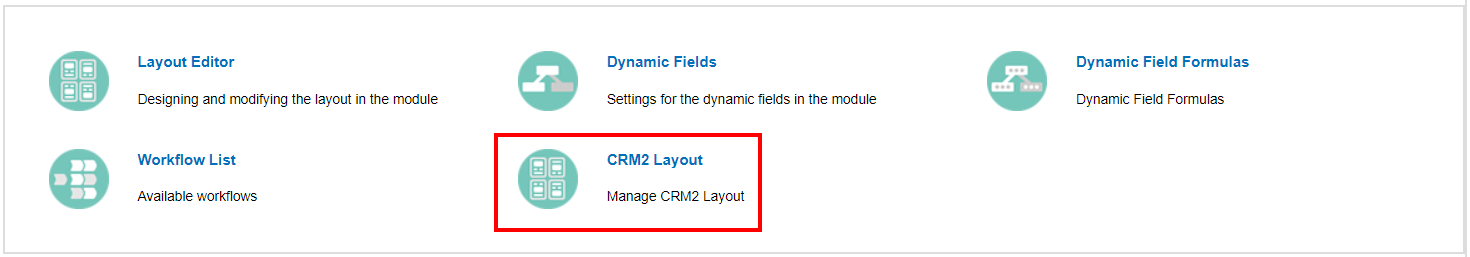
From start to finish, entity charts are created by the admin users. First, they need to be inserted into the entity card via the module manager and go to the CRM2 layout settings (see picture below). In these instructions, we cover the basics of activating the charts for the entity and how they are then modified inside the entity card.
Quick Start Guide
- Go to the module manager and select the module you want to add the chart to.
- Go to CRM2 Layout and add the chart to the wanted place.
- Exit settings and go to any entity card of the module chart was added to.
- Go to the placeholder visible in the entity card and press the settings button.
- Create a chart with wanted conditions using these settings and save.
Step-by-Step Guide
Here we go through all the necessary steps of adding the chart to the entity. The focus of these instructions is on the new functionality, and more details about CRM2 layout settings and charts are available in separate articles.
Enabling the entity chart in the settings
The first step is to set up the entity chart by going to the Module Manager, selecting the wanted module and going to the CRM2 layout settings. Then in the settings, the component is added in the wanted tab by using the green plus icon (see picture below).

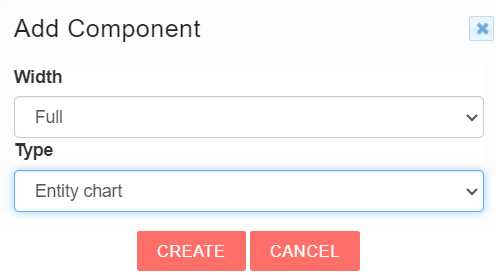
After that, a popup window to add the component will appear. Select the wanted width of the chart (Full/Half) and then select the type Entity chart on the picklist (see picture below).
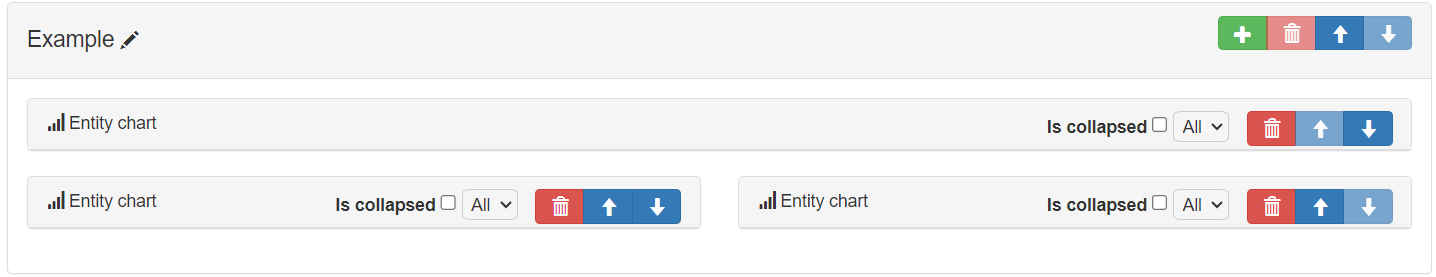
After this, the entity chart is visible in the layout and will be shown on the entity card. It is also possible to create multiple charts for the same entity card if needed (see picture below).
After the entity chart is visible and you are happy with the layout settings, is time to go to create the chart.
Setting up the entity chart
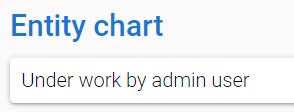
To create the chart, the admin user needs to use the gear icon located on the placeholder to open the chart settings (see picture below). All other users except admin users will only see the placeholder and text “Under work by admin user). The entity charts follow the same rules in creation as the homepage charts, so you can get more details about their creation in this article.

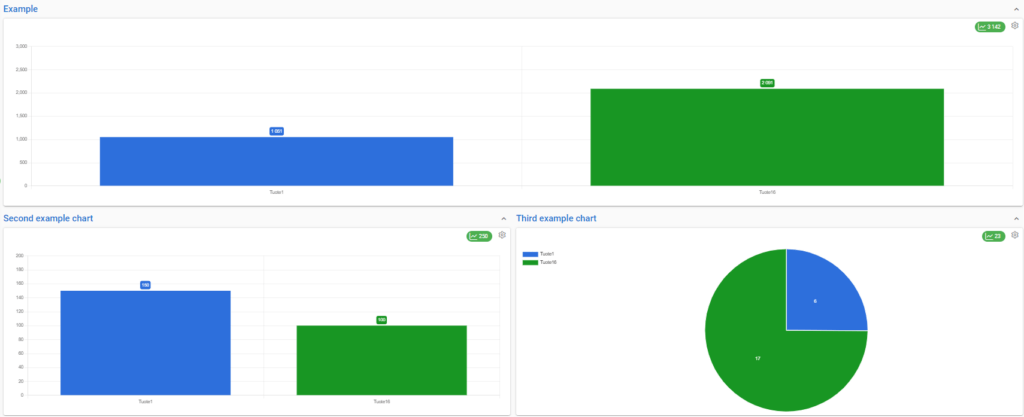
After you are happy with your chart, you can press save. All created charts will be displayed in the entity card and it is possible to edit them afterwards by using the gear icon. You can also delete the chart using the gear icon, and the chart is then replaced by the placeholder. If you want to fully remove the chart from the entity card, you have to remove it from the CRM2 layout settings.
NOTE: Charts are showing data for each specific entity, but all the entities of the same module share the chart settings. This means that charts may look drastically different when switching between the entities and in some cases entity in the module may not contain the data required to show the chart. In these cases, the placeholder will show text explaining the reason the chart is not shown (see picture below).