Bar and Line Chart
Introduction
This guide helps you to create bar and line charts for the user’s home page. To learn more about the home page charts in general and how to share them among the users in a certain sales group, see the guide Home Page Charts.
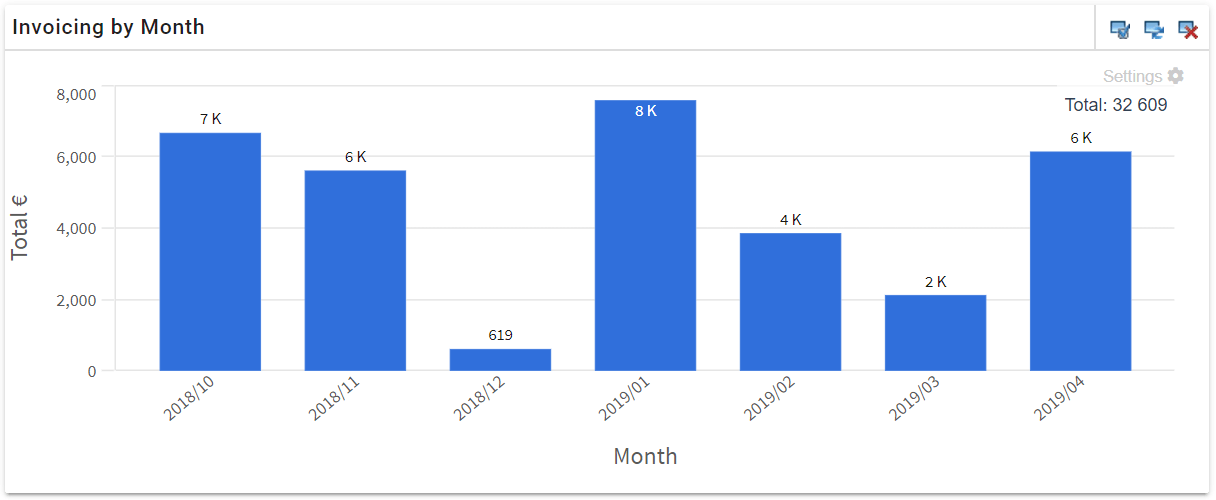
The pictures in this guide represent an example bar chart about the combined grand totals of invoices from the past six months.
Creating the Chart
You can start creating a bar or line chart by clicking the Add button ![]() on the home page and by selecting Chart. Give the chart a name and suitable sharing settings (if needed).
on the home page and by selecting Chart. Give the chart a name and suitable sharing settings (if needed).
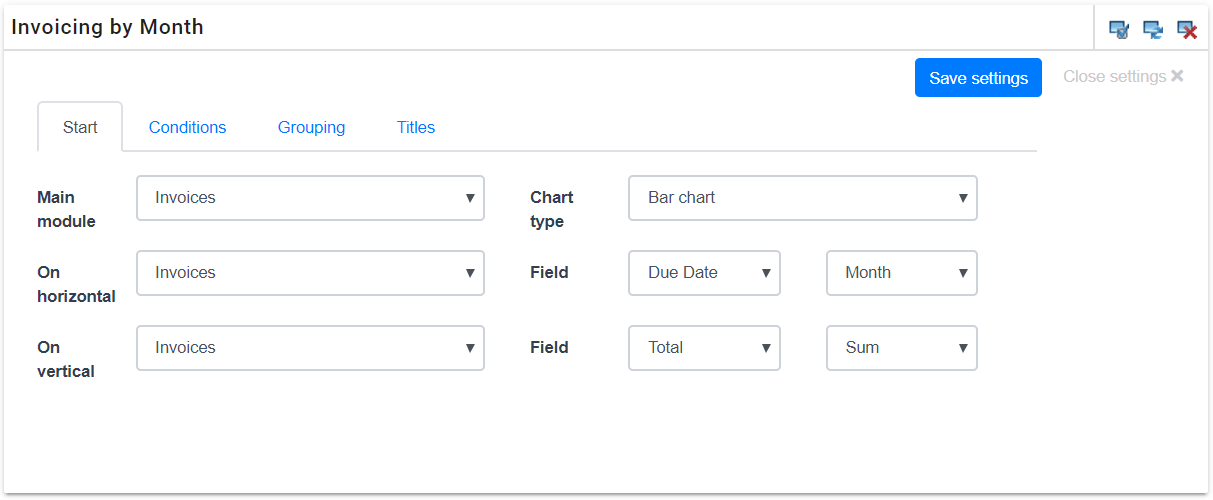
The settings of the chart will then appear on the home page. You can first see the fields Main module and Chart type:
- Main module – select the main module whose information is reported in the chart.
- Chart type – select either “Bar chart” or “Line chart”.
When you have specified the main module and chart type, more settings will appear (see also the picture below).
The fields On horizontal and On vertical are automatically filled with the same module as the main module. In many cases there is no need to use any other modules and then there is no need to change these selections. But if you would want to view e.g. invoices not by month but by user, you would select the Owner module for the horizontal axis.
The reported information is then selected from the Field picklists for both the horizontal and vertical axis.
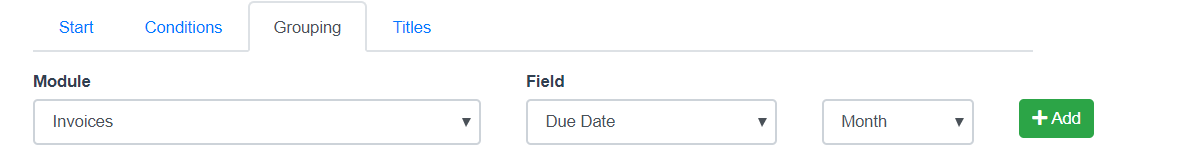
The field on horizontal axis is typically either a date field or a picklist. If you select a date field, a selection for grouping the date will appear next to it (whether the dates are grouped by month, year, etc.). In the example case in the picture below, the Invoices’ Due Date is selected for horizontal axis and they are grouped by months.
The field on vertical axis varies by the need at hand. In most cases a number field is selected (the values in this field are used to calculate sums or averages), but another common case is to select the invoice’s/account’s/potential’s/etc. number or CRM ID, which can be used to count the entities. You can use any field to count similar entities, and number fields can be processed to show sums or averages. In the picture below, the invoices’ grand totals are summed.
When you are done with the settings on the Start tab, you can proceed to other tabs.
Conditions
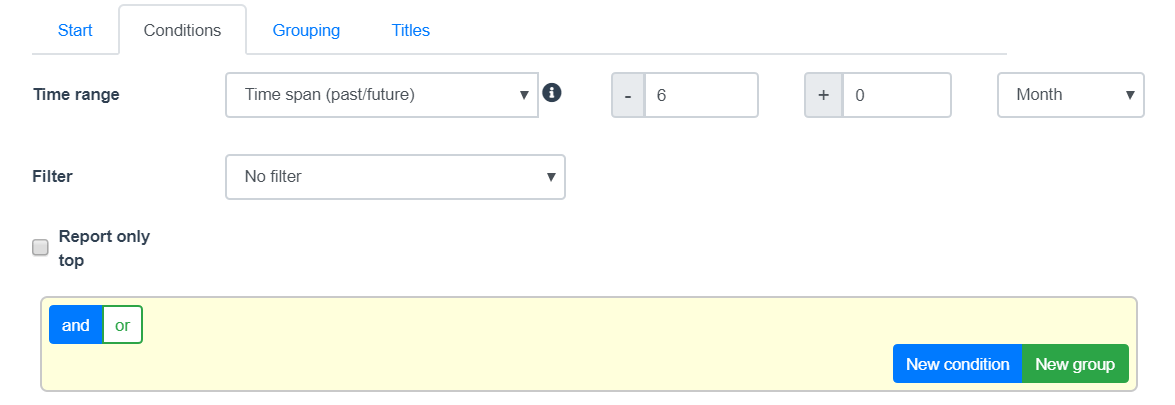
On the Conditions tab, you can set a time range and other limitations for the reported data.
There are following options for the Time range:
- Current year – a full calendar year.
- Previous year – the previous full calendar year.
- Time span – a certain time period to the past or future from the present moment. You can set the time span by typing a number and a measure of time (month/quarter/half a year/year).
- Time span (past/future) – like the previous option, but you can set the time span to the past and future at the same time.
- No time range – ignore the time stamps and use all the data.
NOTE: If you have selected a date field for the horizontal axis, the time range is determined by that field. In all the other cases the entities’ Created time is used.
With the Filter field, you can easily add a filter to make the chart only show data assigned to the logged-in user or their sales group.
You can also create conditions for the chart the same way you would for e.g. a target group (for more information, see the guide Target Groups).
Grouping
Usually you don’t need to do anything on the Grouping tab: the selections made for the horizontal axis are also copied for this tab. If further grouping is needed, you can create more rules with the Add button.
Titles
On the Titles tab, you can make the last adjustments for the chart.
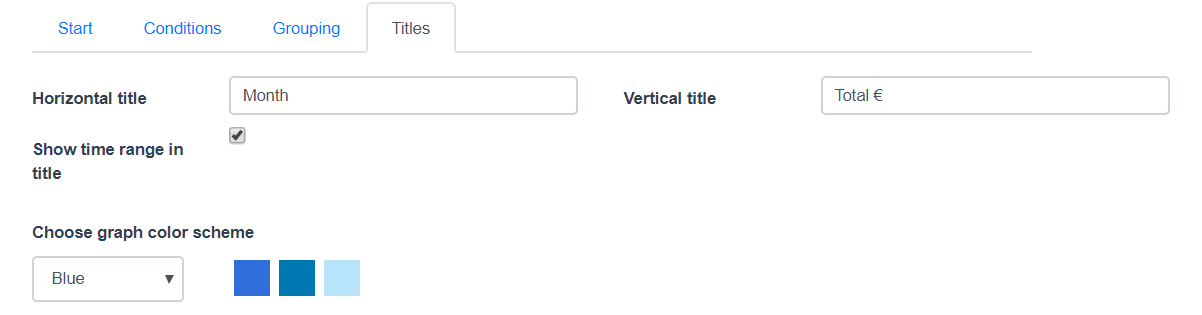
You can set titles for the horizontal and vertical axis with the fields Horizontal title and Vertical title. The activated Show time range in title selection will add a title row that shows the time range for the data in the chart. The last setting is the color scheme used in the chart.
Outcome
When all the settings are ready, you can save the chart with the Save settings button at the top right corner. After that, you can see the chart by clicking Close settings next to it.
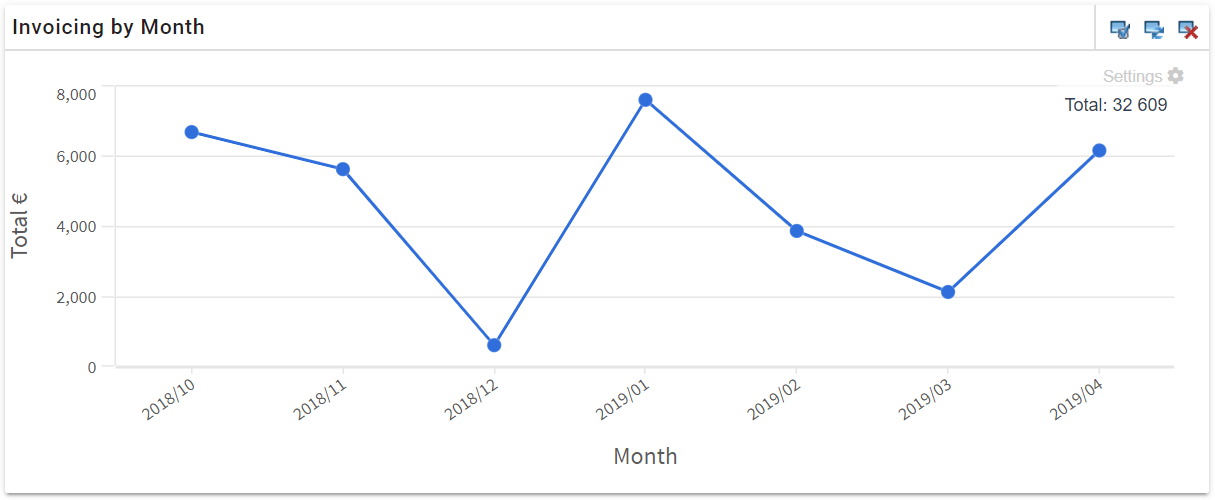
The pictures below show what the example case looks like as a bar chart and a line chart (the settings are the same except for the Chart type).