General
The Targets module is used to set and measure the organisation’s goals. Depending on the target type, the target is measured by amount or monetary value. When monetary value is used, the wanted product group(s) must be selected to determine which products are counted when measuring the set target.
The following target types can be measured using monetary value:
- Invoices
- Quotes
- Sales Orders
- Potential
The following target types are measured using only the amounts:
- Activities
- Communication actions
NOTE: After activating the Targets module through the Module Manager, the admin user must also set the CRM2 layout for the module to be visible in the CRM. See the article Configuring the CRM2 layout for instructions.
How to Create a Target
In the following example, we are going through the steps for creating a new target, and later we show how to follow the target progress using charts.
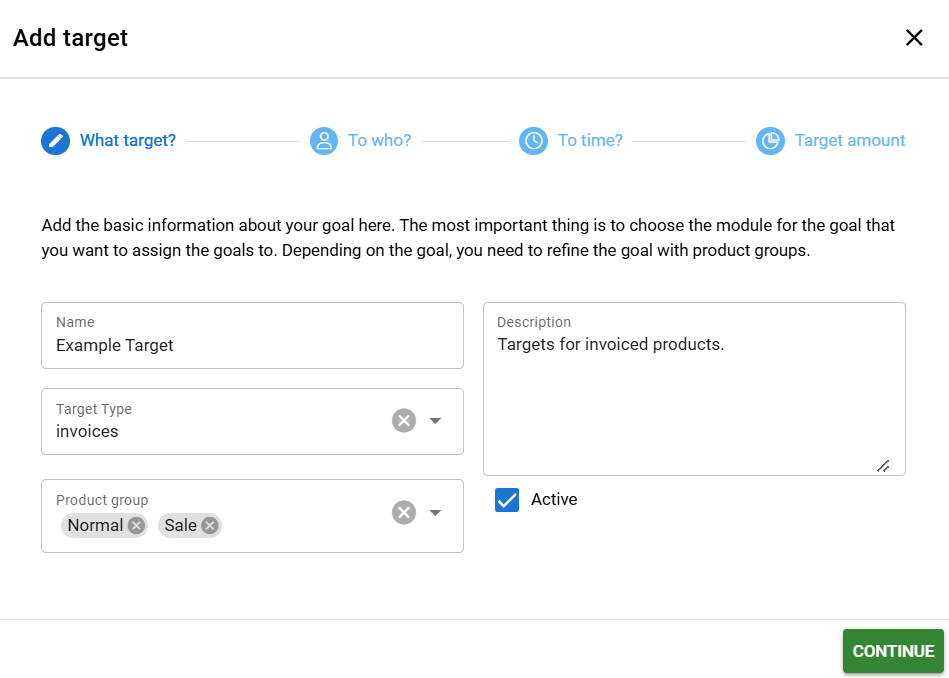
A new target is created by going into the Targets module and pressing New. After that, the settings for the target are determined in the Add target settings wizard (see picture below).
NOTE: Settings made using the wizard are permanent (except for Description and Active -status checkbox). This means that after the set targets and the rows are saved, it is no longer possible to edit them.
Determine Target Type
In the first tab, the user determines the target by giving it a name and type. In this example, we are using the target type Invoices, which also requires the Product group(s) to be set. If the selected target type is Activities or Communication activities, this field is not visible. Target type and product groups cannot be edited after the creation is finished.
Additionally, it is possible to give the target a description and make it active from the moment it is created, but these are optional settings that can be changed later.
Adding Target Users
The second tab defines the users to whom the targets will be set (see figure below). The selection is made either on a user-by-user basis OR by selecting the wanted reporting group(s). In the example picture below we have selected all the users in the Sales Group to be measured.
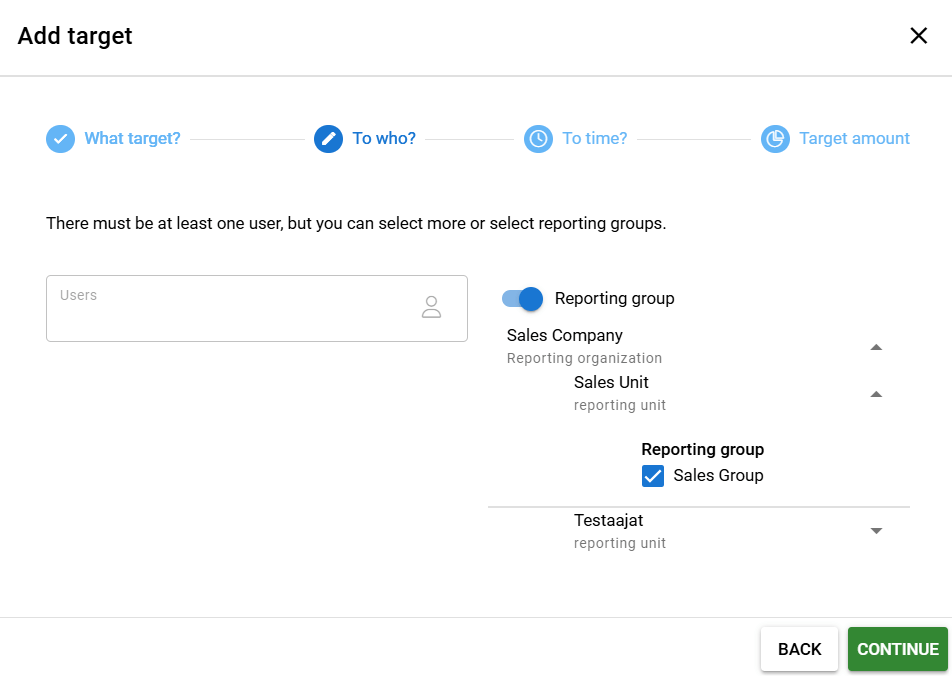
NOTE: It is not possible to select both individual users and reporting groups at the same time.
Time Period
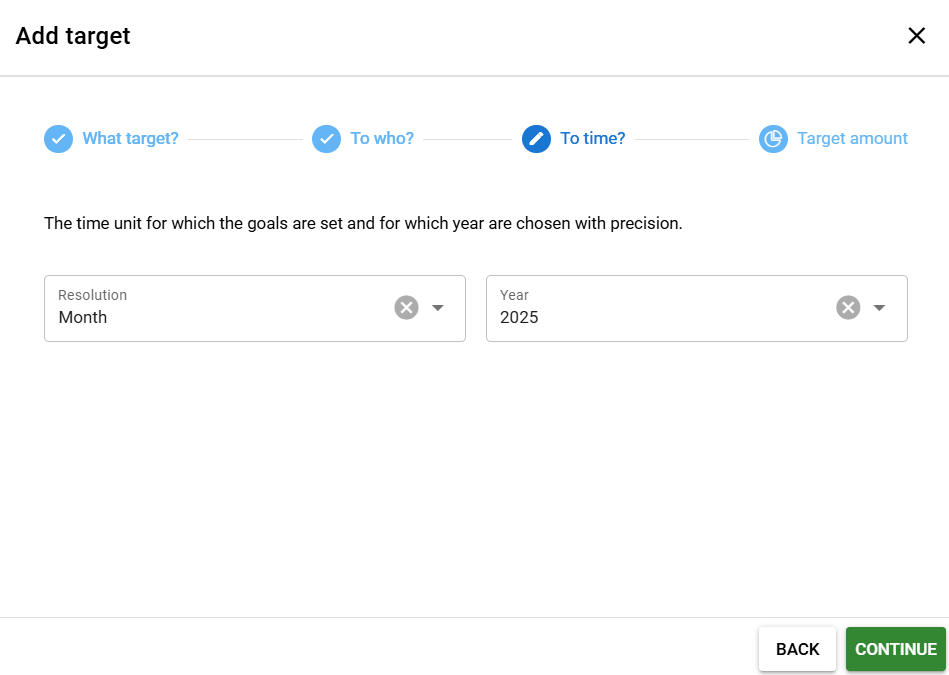
In the third step, it is determined which year the targets are measured and what time unit is used. Settings are determined using the picklists (see picture below). The Resolution picklist determines if the target is measured weekly or monthly basis, and the Year picklist allows users to set the desired year. In this example, we are measuring targets using the Month as a base unit and we are setting targets for the year 2025.
Target Amount
In the fourth and last tab, it is time to set up the target amounts. By default, everything is set to zero. The row next to the name of the user/reporting group is used to measure totals, and the view can be expanded/collapsed using the plus/minus icon next to the name.
NOTE: When amounts are entered, you can only use integers. The Share between option will round the result to the closest integer.
Inside the expanded view users can use the Calculation column to set up the targets for each month/week using one of the two settings – Give to all and Share between (see picture below).
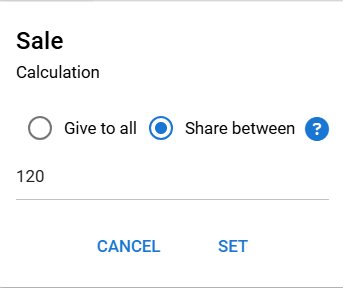
Give to all option sets all week/month targets to the desired number. Please note that it is possible to edit each column separately even after this option is used. This option can therefore also be used to add the most common target amount for all weeks/months, with any columns that differ from this being adjusted separately at the end.
Share between divides the number with the number of weeks/months in the year and rounds it to the closest integer. This also means that the final total can be different than the amount entered.
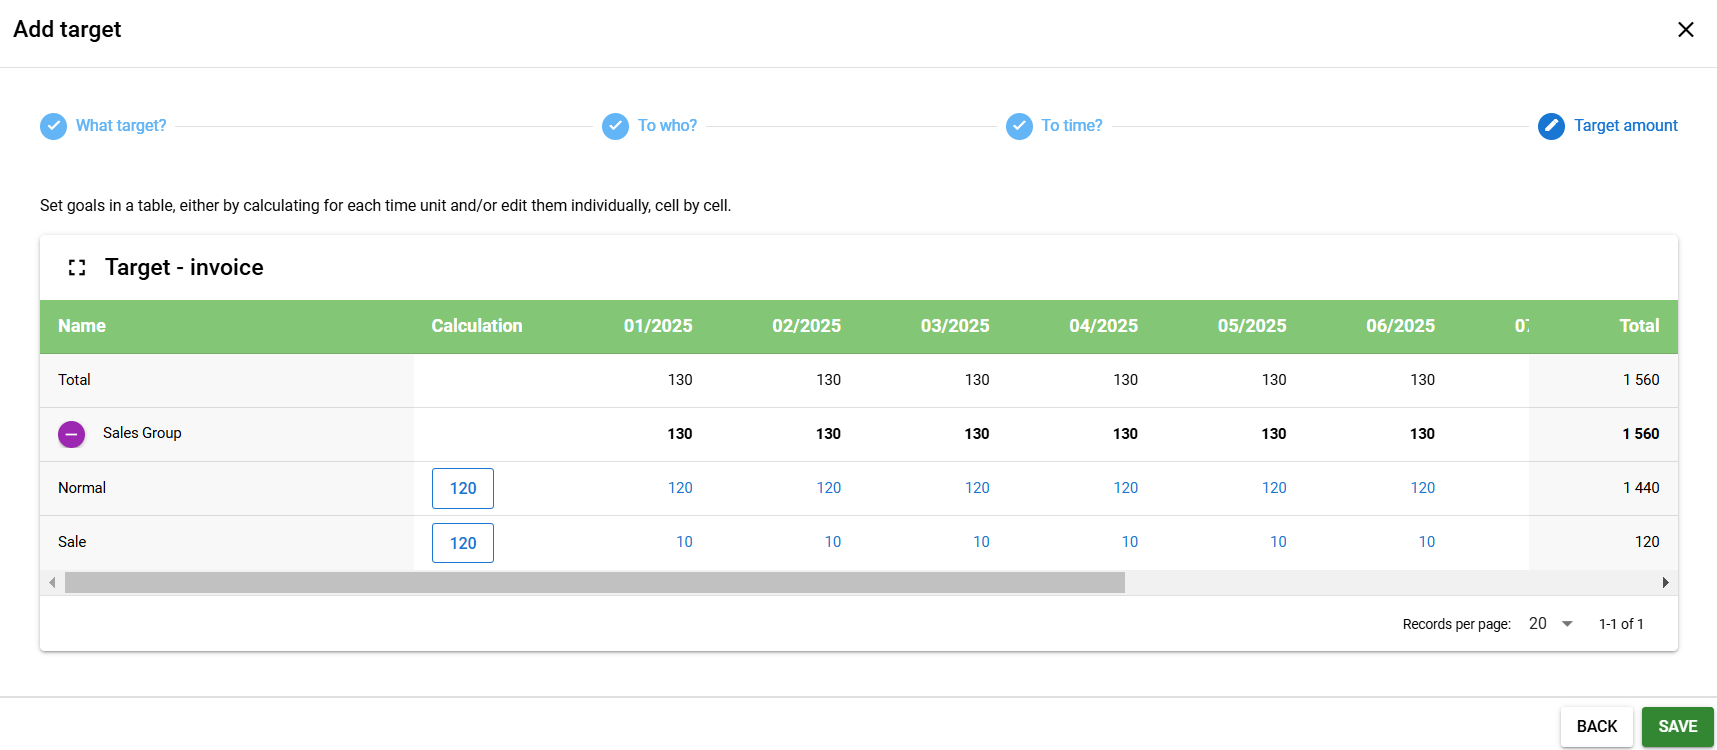
In the example picture above, we demonstrate how both options work with the same numbers. In the example, we are measuring Sales Group targets using two product groups, Normal and Sale. In the Normal product group, we used 120 and the option Give to all, so every month has the same target of 120 and the total is 12*120=1440. In the Sale product group, we used 120 and the option Share between, so every month has a target of 10 because 120/12=10 and the total is 120.
It is also possible to set up each target manually by clicking the number under the wanted week/month and adjusting the number by entering it manually or using the up/down arrows (see picture below).
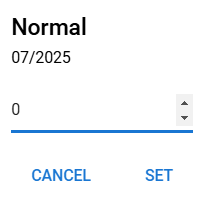
After each column has the desired target, the target is now ready and can be saved.
Rounding
In the example above we have used the number 120, which is shared equally between 12 months is 10 for each month and the total is shown as 120.
However, if we use any number between 121 and 125, the system will still calculate the target to be only 10 per month and the total remains 120 since everything under 0.5 is rounded down. But if we raise the amount to 126, the system will round up the resulting 10.5 to 11, and the new total is 132.
Since it is possible to edit columns manually, Share between can be used to easily divide wanted targets equally, and then the user can edit individual columns until the total is the wanted original amount. It is good to note that if the result is under 0.5 per week/month, everything is shown as 0 because of rounding down. So if the target is between 1-5 when measuring targets monthly or between 1-25 when measuring weekly, the Share between option sets everything to 0.
Target Chart in the Dashboard
After you have created the Target, it can be visually shown and shared using the dashboard. Next instructions describe in detail how you set up the Targets element on the dashboard. For the general instructions on the dashboards, see the guide Dashboard management.
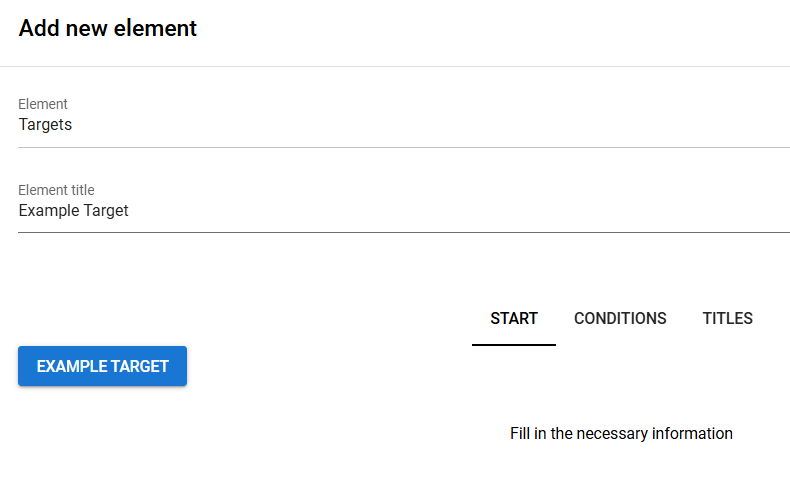
After you select the element Targets in the Add new element window, you only have Start tab (see picture below). To get more editable options, you must use the Select target button to pick the desired target.
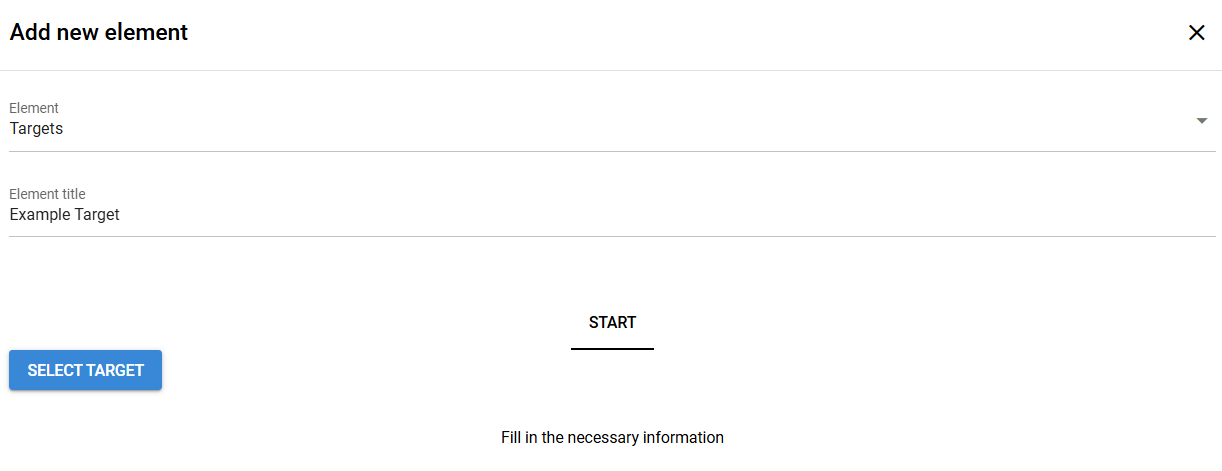
After the desired target is selected, the user gets all the available settings, including conditions and titles. The Select Target button changes to show the name of the Target, in this case Example target (see picture below). From this forward, the creation of the chart follows the same logic as other charts. For more information, check the guide Home Page Charts.
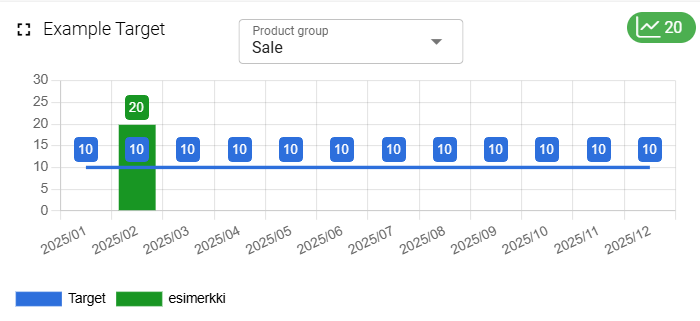
In this example, we are measuring the total sum of sold products by users in the desired reporting group and belonging to the product groups we have previously selected. This example uses due date to separate invoices in the right monthly columns. In the picture below you can see the end result where the line represents the set target and the stacked bars show the results the reporting group has achieved. Individual results are shown visually in colors, and drilling into chart shows more detailed information.
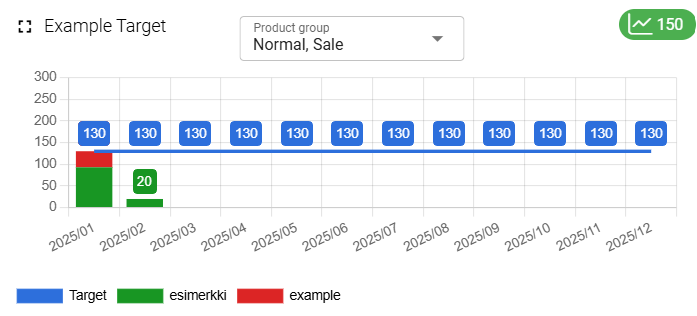
In the default view all possible product groups with their total goal are shown in the chart. This is always the first view user sees, but they can use the picklist in the chart view to browse through different Product Groups individually (see picture below). This is a quick view function, so after exiting the dashboard showing the target chart it changes back to the default view.
