General
Surveys are used for various purposes, from gathering feedback to collecting and updating contact information in the CRM. This guide refers to the full survey editor that creates surveys that can be shared via a link. The editor can be used with a combination of mouse and keyboard, but it also supports keyboard-only inputs.
The limited edition of the survey editor is also used to create mass event registration forms, which have their own guide Mass Event Surveys.
Start
The survey is first created by entering the survey module, pressing the new button, entering the wanted information, and pressing save. For more detailed information about creating the survey, check the guide Setting Up a New Survey.
After the survey entity card is created with the steps above, press the module tool button and select Add/edit survey to enter the survey editor. We will go through the basics of the survey editor here, but for a more in-depth look at the editor check the guide Survey Editor.
Adding Questions to the Survey
Questions and other elements are added to the survey via the survey designer tab, which is the first view after the editor has been opened. Questions can be added to the survey by clicking them or using the drag-and-drop feature. More information about the question and element types can be found in the guide Question and Element Types.
Each question and element has its own set of settings, which can be edited by selecting the wanted question. This takes the user to the right spot in the settings panel. For a more in-depth look at different question settings, check this guide Question and Element Settings.
Customising the Look of the Survey
The look and other attributes of the survey can be edited in two different locations. Firstly, the General settings of the survey control the header logo, navigation buttons, page and question settings, and so on. You can read more about all the available general settings in the guide Surveys – General Settings.
To edit the look of the survey, we have the Themes tab. This can be used to change the colours, shapes and sizes of different elements of the survey. Themes have their own in-depth guide Survey Themes.
Survey Preview
The preview tab allows you to see the survey with the eyes of the respondents. Preview is especially useful when testing that different validations and other custom settings work properly. After the survey is completed in the test mode, you can view the results in a table or in JSON format.
You can test how the survey looks on different devices by locating the Select device type -icon from the top-right corner of the survey editor and selecting wanted device from the picklist.
Saving and Copying the Survey
Surveys are saved as a JSON object in the survey’s options field. If after saving the survey remains empty, please check with your admin user that this field is active. Do not edit this field manually! The options field is also used when the survey is copied by creating a module tool Link to another module with the following parameters:
options={$options}
It is also possible to make templates that automatically save specific settings in each survey during the creation of the survey. If you are interested in your own custom template(s), please contact our support team and we are happy to make you one.
Survey Translations
Every survey has English as a default language option. More languages can be added through the translations tab. When the survey is sent to the respondent via email link, the survey will open in the language which is the default at the time the respondent opens the survey.
An easy way to send different language variations is to create one survey with all the available translations. Then, this survey can be copied, and the default language for each one can be edited to match the desired language. It is good to add the language also in the survey’s name.
If the survey’s answers need to be compiled in one place when different language variants are used, simply use Excel export and compile the Excel files. When the base of the survey is the same, the answer locations in the Excel exports are identical regardless of the language the user has responded to.
Reports Tab
The Reports tab allows the user to view the survey responses in a graphical format. The first object displayed on the Reports tab is a line chart showing the number of answers per month. The total number of responses is shown in the top right corner of the line chart.
Below the number of answers per month, we find graphs showing the responses to individual questions. The graphs are automatically displayed for questions that are suitable for displaying the data in graphical form. For example, text-type questions are not shown in these graphs.
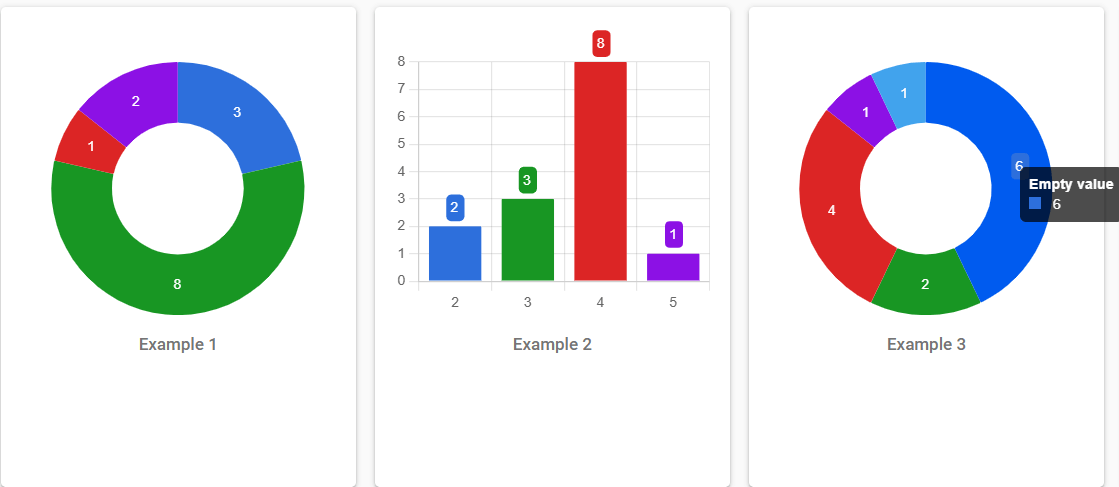
The most common way of presenting the data for the answers to a question is a doughnut chart (Example 1). For classification-type questions, the data is displayed in a bar chart (Example 2). By hovering the mouse cursor over the graph, the user can see the individual value displayed in the graph, for example, how many people have not answered a question (Example 3).
Surveys – Frequently Asked Questions
Can I edit the style of the survey?
In the survey Theme settings, you can edit multiple style settings like fonts, backgrounds, etc..
Does the survey scale for mobile devices?
Yes, the survey will scale for mobile use, and you can use the preview settings to check how it will look on different devices.
Can I use a template when creating a survey?
Survey Editor has a few ready-made theme templates for easy-to-use layout settings. You can also make a survey you like and then copy it by using a module tool [insert link]. It is also possible to order a special template made by us for you by contacting our support.
Can I edit the survey after it has already been sent?
Editing the survey is always possible on the surface level, assuring that respondents will get perfect survey. This means that question title and answers visible to receivers can be edited at any time. However to avoid logical errors the values related to question and its answers will be locked from edits after there has been at least one answer to the survey.
How many times users can answer the same survey?
Survey answers are limited to one per sent link to automatically prevent multiple answers for the same survey. If there is a need to receive multiple answers from the same person, using a new email with the survey link does the trick.
Can I edit the survey answers tab to organise the answer data the way I want?
The Survey Responses tab only allows you to view the responses and organise them by date. However, you can always use the Excel export feature to get the answers into the Excel spreadsheet where you can sort, organise and edit them as you wish.
Is it possible to see the answers in the form of graphs?
Where possible, the Survey Responses tab will display the responses to the question using a doughnut or bar graph. This feature is available for all fixed answer question types, but not for open-ended questions such as text answers.