General
KPI is part of the filter settings and the information it provides will be visible at the top of the list view.
KPI can be used to display more accurate data in different styles. A maximum of three KPI points can be created and appear at the top of the page. Using KPIs, it is possible to monitor how effectively the organization achieves its business goals.
KPI can, for example, be used for the following:
- Compare values with each other
- Display values in a pie chart
- Sum based on the selected value
- To show the average of the value
- To show the total sum of the value
In this guide, we go through the most common use cases and examples of KPI. We also go through the advanced settings that can be used to enrich the information given by the KPI.
Once you have saved the KPI, its location can no longer be moved. If you want to change the location of the KPI, it must be deleted and done again.
Start
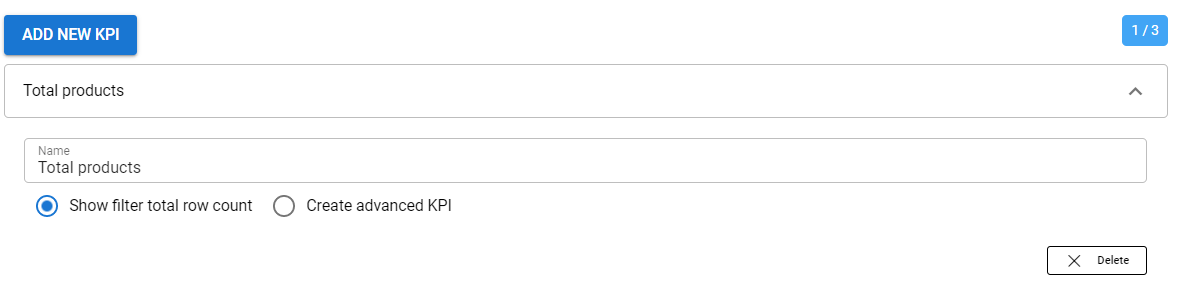
The name of the KPI should be something that shows what data the KPI describes. By clicking the Create more advanced KPI, a gray field opens and you can drag wanted values there. The list on the right lists the values that can be used to create a KPI.
In the following examples, we go through different ways of using KPI in the module, which in this example is Products.
When you want to show how many products there are in total, you can create a simple KPI, i.e. just fill in the name field. This kind of KPI counts the products in the Products module to get the total amount. Remember to Save at the end!
View in Products module:

Example for Pie chart/Compare to the summary of other values
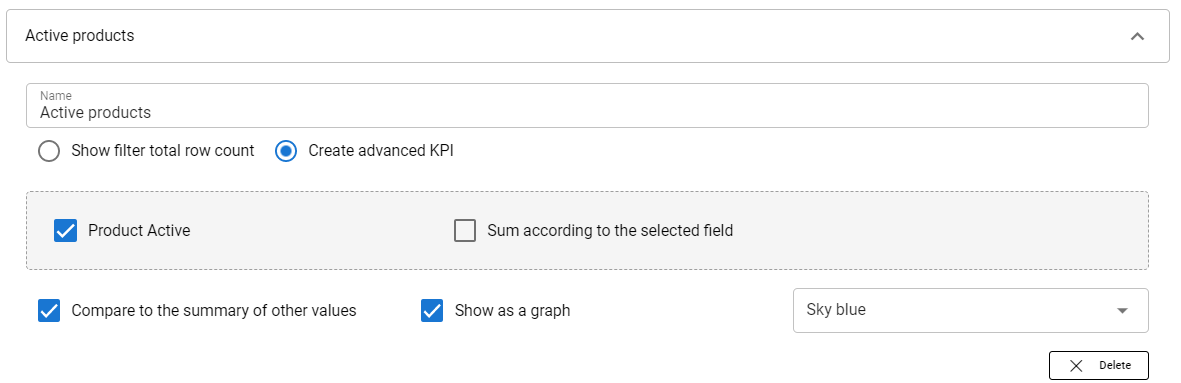
Next in this example, we want to use a pie chart to show how many products the organization has active, i.e. the Product active value is used as the basis of the KPI. This can be done using the following steps:
- Drag the Product active value from the list on the right to the gray field.
- Click on the Show as a graph box.
- In the same formula, the Compare to the summary of other values selection can also be made.
- In this example case, the number of products that are not active will appear under the number of Active products.
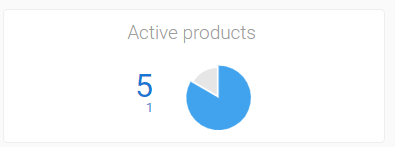
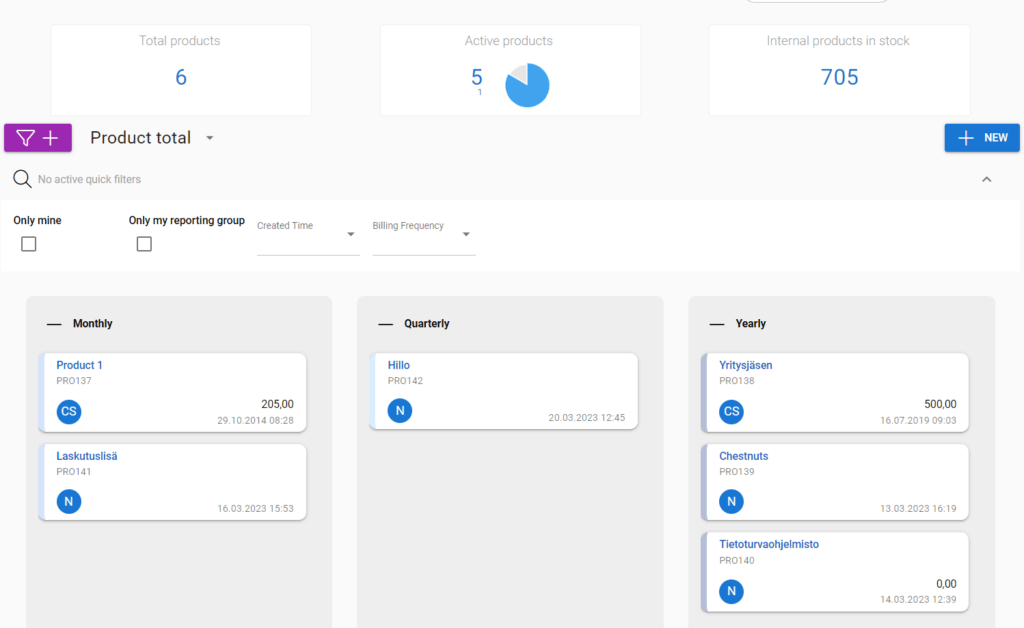
View in the Products module in a situation where the organization has five active products and one inactive product:
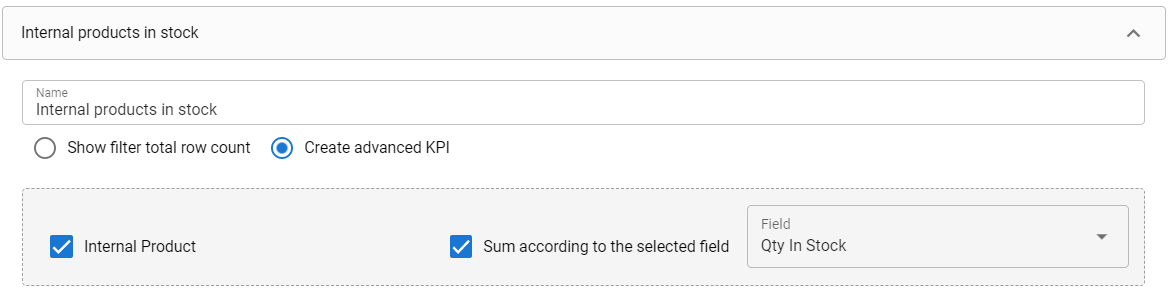
Example for Sum according to the selected field
The KPI that shows the amount of the internal number of products in stock is obtained with the following settings:
- Drag the Internal product from the list on the right to the gray field.
- Check the box in the Sum according to the selected field.
- Select the field to sum, which in this example case is the Qty In Stock.
View in Products module:

The end result in the Kanban view
Advanced KPI Settings
When creating advanced KPI, you can also use Advanced settings. These settings allow users to adjust the information shown by the KPI and they look like this:
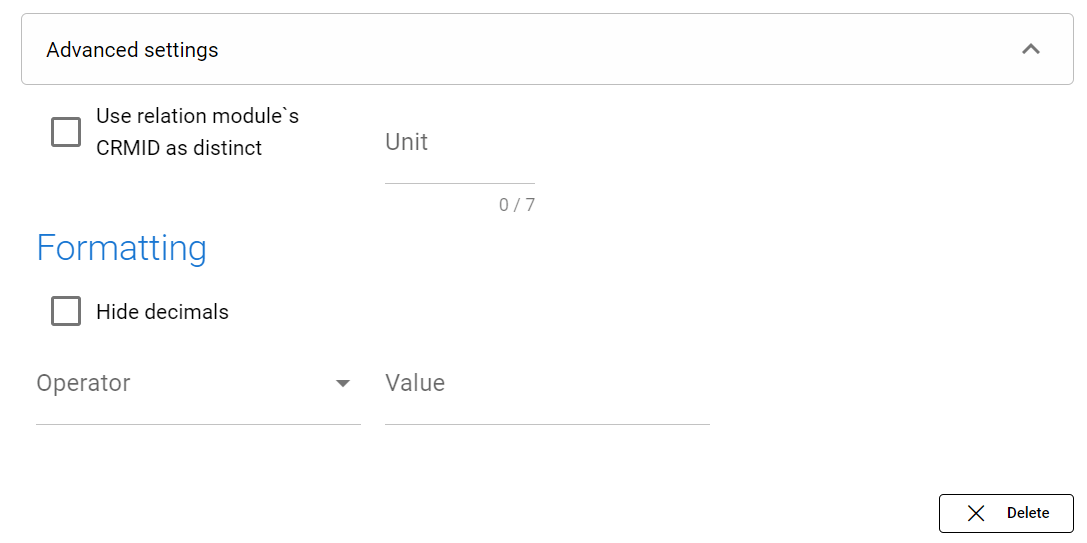
- Use relation module’s CRMID as distinct option allows users to narrow down the results of the KPI. This can be used for example to show how many unique members are currently being invoiced.
- Unit can be any combination of 7 characters. This can be used to add things next to the KPI number, so for example if division by 1000 is used, the unit can be k and in that way, 10 000 can be written as 10 k in the KPI.
- Hide decimals can be useful when doing KPI calculations. So for example, if we have 13 186 accounts and divide by 1000, we get 13,186. But if we use the Hide decimals option, we get 13.
- Operator and Value can be used to make different types of calculations – Add, Subtract, Multiply and Divide by any number you need by using these two options.
Example of KPI created using advanced settings
In this example, we want to make a KPI that tracks the total sum of all the sales, but since numbers are large, we want it to be in a more precise form so the KPI is easier to read. So we use the following settings:

We are tracking the total of everything, so the distinct option is not used. But we are using the unit k (kilo) so the reader can see that we are talking about thousands in this KPI. Then for formatting we hide decimals, choose the operator Divide and use the value 1000.
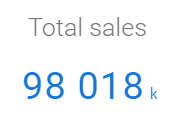
With these options, the KPI that previously looked like this:
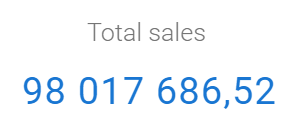
Is now looking like this: