General
In the CRM, a filter refers to a general list view in a module, which shows the module’s contents – accounts/contacts/quotes/etc. – as a list. The filter determines which fields are shown as columns, the order in which the entities are shown, and if some criteria delimit the entities.
There can be several filters in each module for different kinds of needs. For example, the default filter in the Invoices module could list all the invoices without any limitations in the order they were created. Still, if necessary, one could select another filter that would show only the invoices that have not yet been sent.
In addition to filters, you can also create Kanban views for the modules.
Start
The list view created by the default filter will always automatically load when the module is loaded. The user can also change the default filter if they want.
Filter Quick Start Guide
- Every module comes with a default filter that users can’t edit or remove.. However, it is possible to change the default filter.
- The fields and conditions of the filter determine what information the filter displays in the list view.
- As a user, you have the option to select up to ten favorite filters that will be displayed in your bookmarks bar alongside the filter management button labeled “Choose Filter.”
- To create a new filter, press the copy icon next to the filter you want to use. Then, edit the filter template to customize it to your liking.
- Users have the ability to adjust or delete their filters to suit their individual requirements.
- To retrieve information from another module, simply add a relation using the filter.
Filter management
To manage filters, simply press the “Choose filter” button.
By pressing the button you reveal a menu that shows all filters available to the user. In addition, the menu contains all filter management tools (picture below).
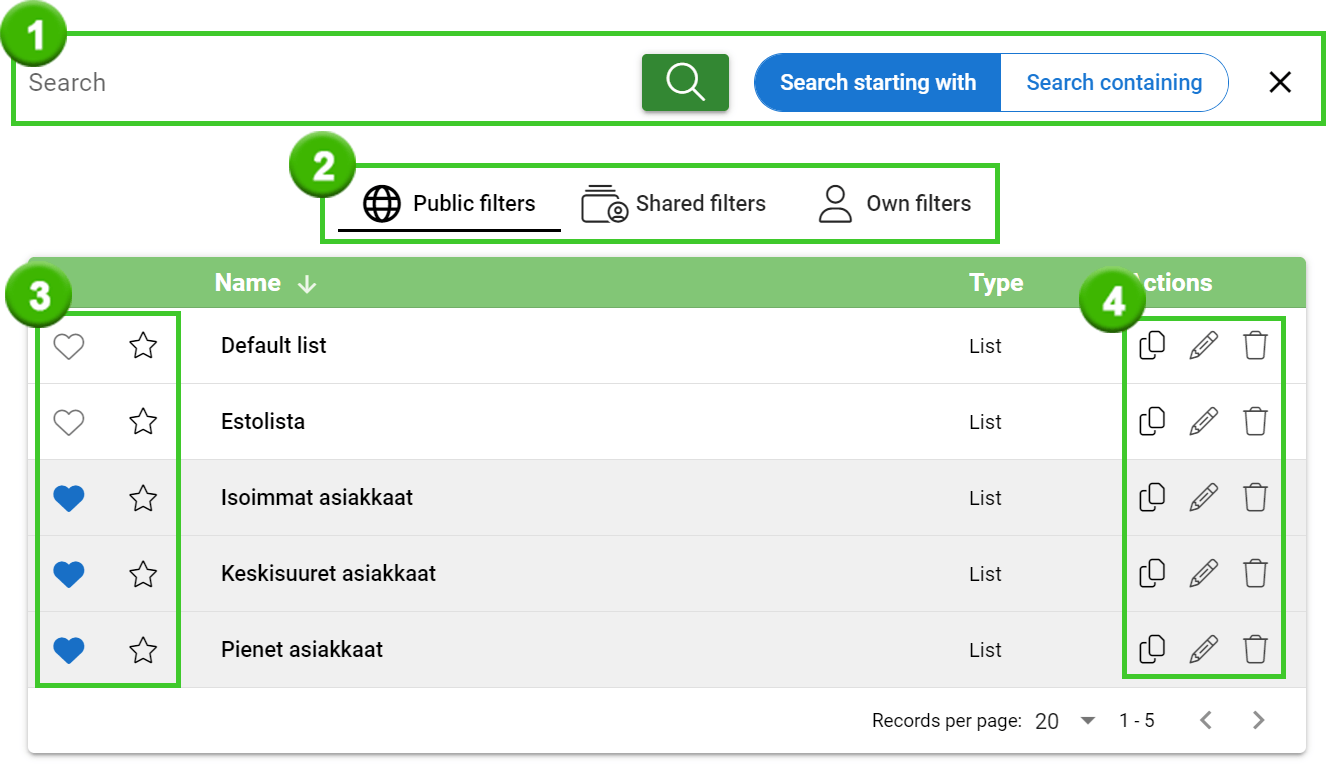
- Filter search – enter the desired conditions and press the search button (magnifying glass), after which you will see the filters that meet the search conditions on the current filter tab.
- Filter tabs – the filters are divided into their own tabs to make switching them easier. The black line below the tab indicates which tab the user is on at any given time.
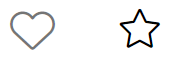
- Favorites and default filter – The favorite filter is represented by a heart, default filter is represented by a star. One module can have only one default filter and ten favorite filters. The currently active default filter is marked by a yellow star and active favorites are marked by a blue heart.
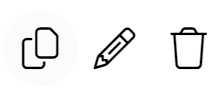
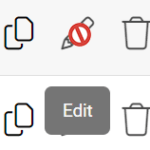
- Filter management functions – filter management functions from left to right are Copy, Edit, and Remove.
List view
With the help of filters, the information contained in the module can be displayed in two different ways, which are the list and the Kanban view. Kanbans have their own guide, so in this guide, we go through the list view. A list is the most typical way to present the module information, and every default filter that comes with the system displays the module information as a list view. Below is a picture of the general view of one module and the parts related to filters and lists are marked on it.
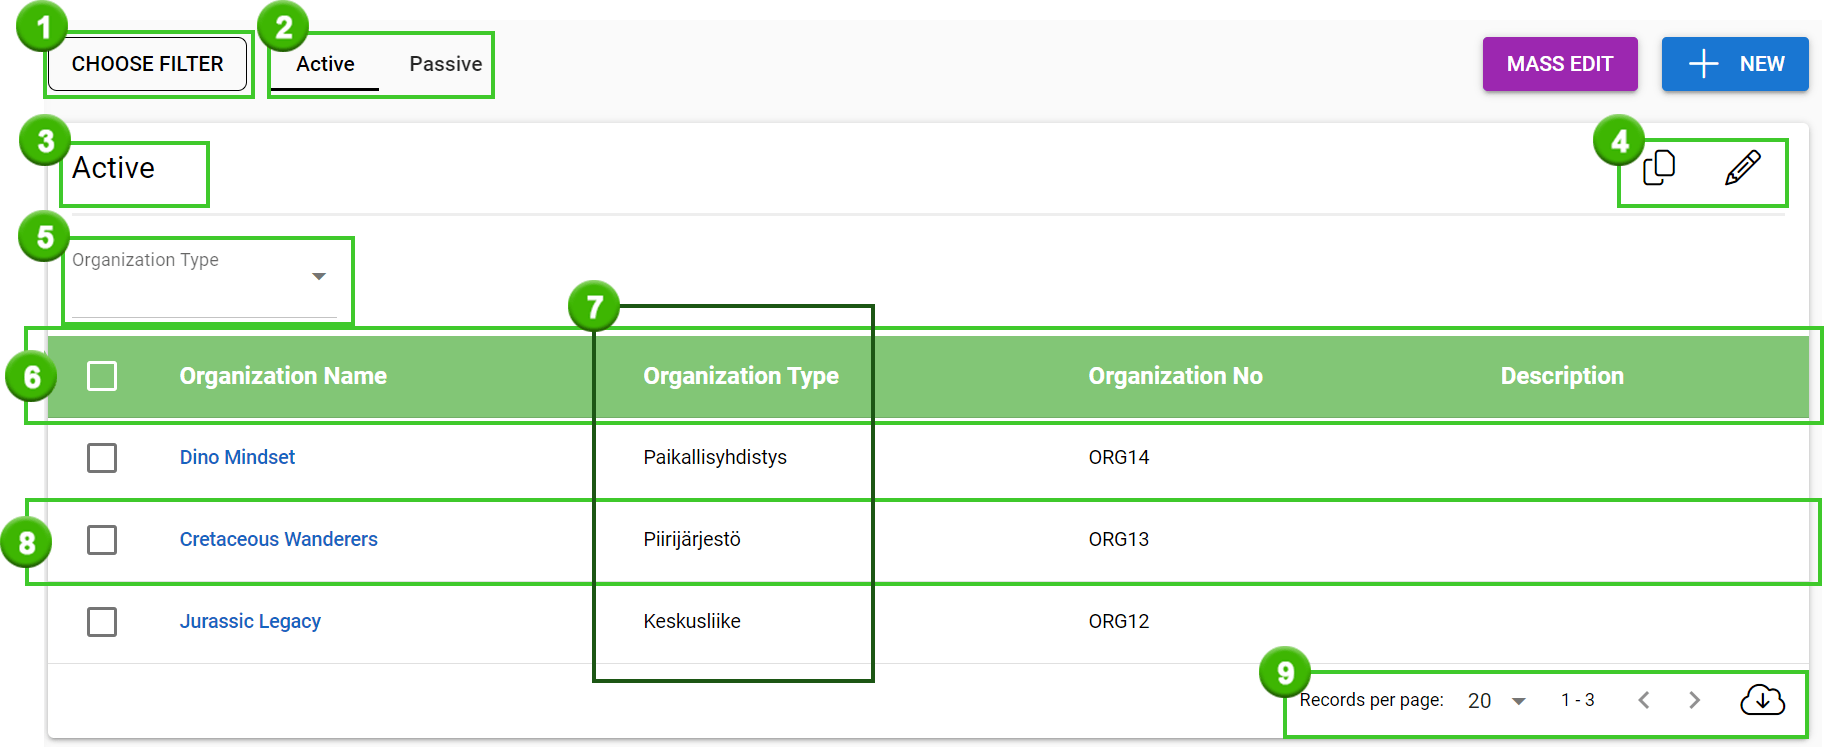
- Choose Filter – this button opens the filter management view.
- Favorites – here user can see their favorite filters.
- Currently used filter – shows the name of the filter currently in use.
- Quick management buttons – these buttons allow the user to copy the current filter as a template for a new one or modify the filter.
- Quick filter – certain field types can be used as quick filters on the list view.
- Header row – the names of the fields selected in the filter are displayed here, and they also serve as the headers of the columns of the list view in the downloaded Excel files. The empty box at the beginning of the bar can be used as an aid in mass editing, as it selects all the lines on the page with one click.
- Column – each field selected in the filter is displayed in the list view as its own column.
- Row – each entity (in the example image Account) has its own row in the list, where all the information is displayed.
- List control functions – From the dropdown menu, you can define how many entities the list displays on one page. Use the arrow keys to move from one page to another, and the button to download the information in the list as an Excel file.
Quick filters
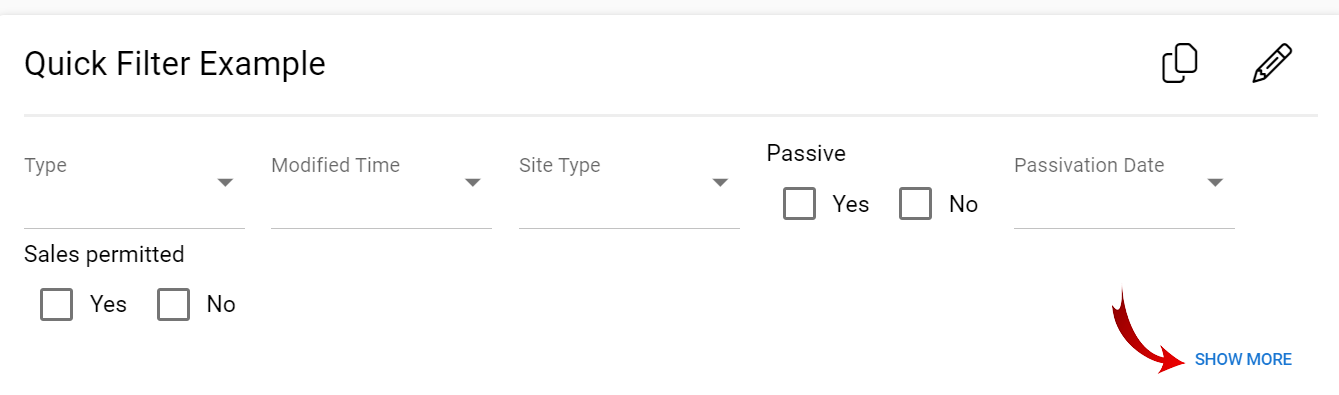
Quick filters show the fields in the list whose type is either a selection list, a selection box, or a date. They can be used to quickly filter the desired information from the selected list, such as for example entities of a certain type or all entities created in a certain time period.
There can sometimes be so many quick filters that you don’t want to keep them all visible at once. For this, in the lower right corner of the quick filters, you have to click the Show more text if there are more quick filters to display. Similarly, there is a Show less button that hides some of the quick filters from the list view.
Rows and columns
Each field has its own column and each entity in the module has its own row. If the text appears in blue on the list, you can access it by clicking on the card of the entity in question. By clicking on any part of the row with the mouse, the entity card to which the information in that row applies will open. So, for example, in the Customers module, the card of the customer corresponding to the row opens.
The top bar of the columns acts as a title bar and shows the names of the fields from which information is retrieved in the list view. Unless the filter settings specify otherwise, by default the filter sorts the entities in the order they were created. However, each list can be sorted in the list view by the entities according to the data in that field in ascending and descending order for fields that support this feature. This is done from the arrow that appears to the right of the field name when the mouse is hovered over the field name.
![]()
The information contained in the fields is displayed in rows as text or, in the case of checkboxes, as boxes. In the case of entities included in the system (organization in the example image above), the text also acts as a link to the card of that entity, so you can also view information coming through the link in more detail directly from the list view.
Showing the entities behind the relation
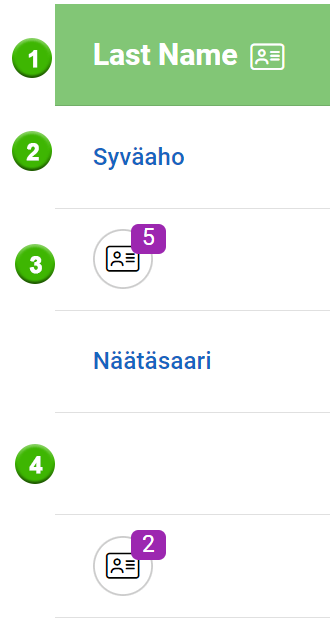
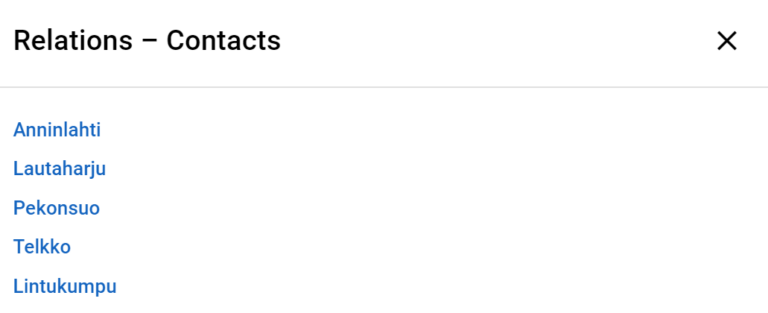
Entities behind the connection are marked with an icon, the type of which also indicates the type of information (1). If there is only one entity to be displayed, it is displayed as text that also acts as a link to the card of that entity (2).
If the information in the line covers several entities, the number next to the icon shows how many entities this list item applies to (3). Pressing the icon opens a dialog box, the information listed serves as links to the cards of these entities, that is, in the case of the example image, to the cards of the contacts of the selected entity.
If there is no information available in the line or the user does not have the rights to see the entity in question, that part of the row is empty (4).
Excel-export
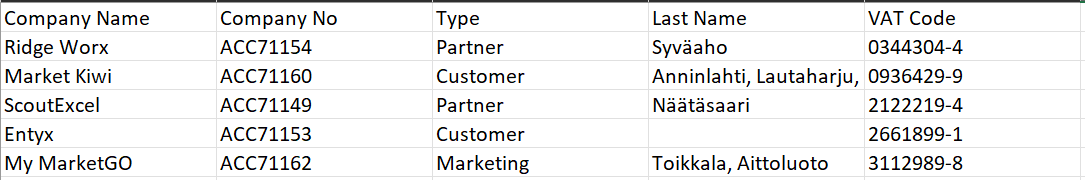
The information contained in the list can be downloaded as an Excel file via the XLS button located in the top right corner of the list view. The rows and columns display the information in exactly the same way as the list view, but if there are several entities to be displayed, they are displayed in the same column, and the individual entities are separated from each other with commas. That is, the rows of the Surname column shown in the previous paragraph would appear in Excel as follows:
Filter management
The filters are managed via the menu buttons (pictures below). On the left side of each filter’s information are the Favorite and Default filter buttons, which allow the user to quickly get hold of the most important filters. The rest of the buttons can be found on the right side of the filter information.
If the user has the rights to a filter, it is possible to copy it as the basis of a new filter. With the basic user rights, you can only modify and delete your own filters, while the admin user also has rights to general filters and filters made by others. If the filter has only been shared with the user, and because of that it cannot be edited or deleted, the system displays a red blocking icon as a sign of this (picture below).
Default filter
Each module always has at least one filter, the Default list, which presents all the entities in the module in the order they were created. This filter that came with the system cannot be edited or deleted, but it can be copied as a basis for creating a new filter.
The default filter is the list view that appears first when opening the module or when the module page is refreshed. The default filter is easy to change – just press the star icon next to the filter you want and the star will turn yellow, marking the filter as the default filter for that module.
Favorite filters
The user can mark the filters they want as favorites, so they will appear in the bar placed next to the filter management button. If all the favorite filters do not fit in the same view, you can browse through the favorites using the arrow buttons on the bar. Filters can be added and removed from the control view using the heart icons.
A maximum of ten filters can be marked as favorites at a time, and if the user tries to add more of them, the system will give an error message and ask to delete the favorite before adding a new one. A filter marked as a favorite in the list of the filters management view can be identified by a blue heart.

Filter search
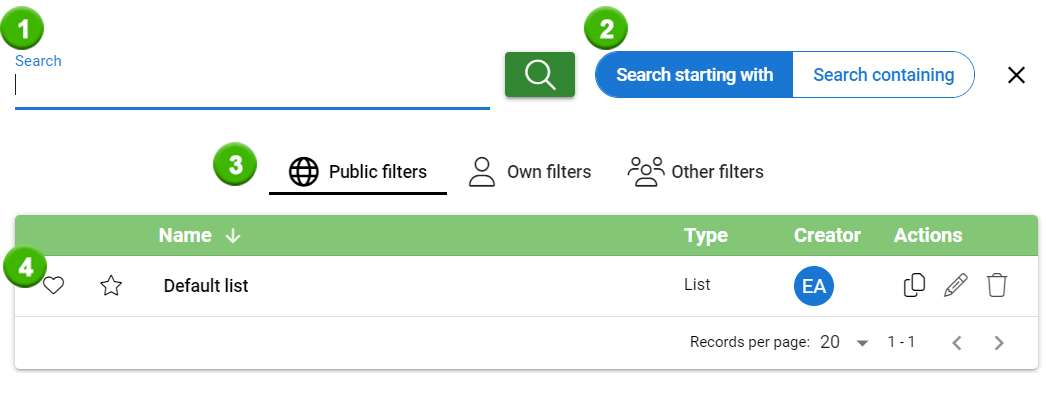
Filter search is located under the Choose filter -button. Clicking this button opens the filter handling menu (see picture below). When you want to search for a specific filter, you type what you want to search in the text field (1) and start the search by pressing enter or clicking the magnifying glass. Search starting with and Search containing options (2) can be used to narrow or broaden the search.
It is very important to know that filter search only searches from the current tab you are on (3). The active tab is underlined, and filters in that tab are shown on the list (4). Sometimes tabs can contain multiple pages and filters, so search function is useful for finding a specific filter on the tab you are currently on.
Creating a new filter
Press copy button to create a new filter. The desired filter is copied as the basis for the new filter, so in order to save time, it is recommended to choose a filter that already has the columns and/or conditions needed in the new filter.
A quick guide to creating a filter
- Select the desired filter as the template for the new filter with the Copy button.
- Let’s give the basic information about the filter.
- Let’s define the fields that the filter displays in the columns of the list.
- Optional step: Limit the information displayed by the filter based on the wanted conditions.
- Optional step: Adding KPI view(s).
Things to consider when creating a new filter
Filters can be used to fetch information from multiple modules, which must be taken into account when creating the filters. Relations affect the functions of the filters, so when you are creating the filter, you must first consider what purpose the filter is going to serve.
Filters with multi relations can be recognized by the warning sign placed next to the name of the filter. This warning serves as a reminder that all functionalities will not work as expected with this list (picture below). Multi-relations are explained more in-depth later in this article in the Conditions part.
![]()
KPI
If the purpose of the list is to create KPI views, you should not create the filter using multi-relation. Always create every filter using KPI views in the module where wanted information can be fetched without multi-relation.
Excel export
If the purpose of the filter is to create a list that is going to be exported using Excel, it must be taken into account that Excel may print more rows than the list view shows. This is caused by the fact that normally Excel will show information behind other entities separated by a comma, but when multi-relation is used, all entities will print in separate rows (picture below).


When using Excel export in the list containing multi-relation, the extra rows printed are identical. If you export this kind of list, you can remove the duplicates by using Excel’s built-in functionalities. Select either wanted rows or all rows of the wanted file and go to Data -> Data tools -> Remove duplicates.
Basics and relations
First, basic information and connections are defined for the filter, i.e. the following settings:
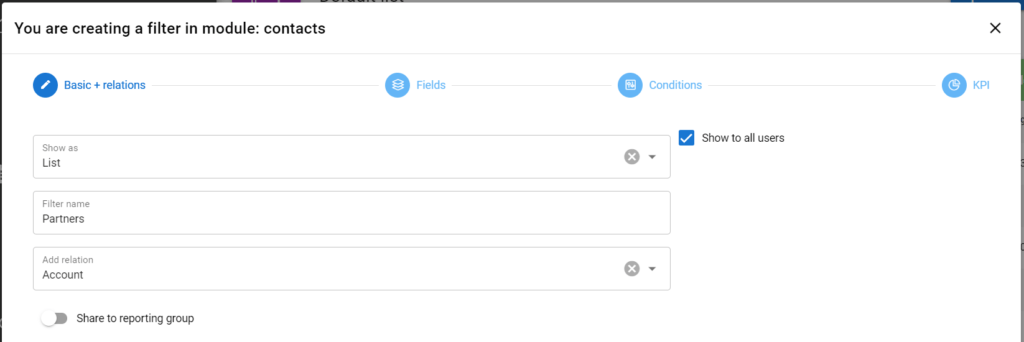
- Show as – In the case of a filter, the presentation method should be List. Kanban is also an alternative.
- Name of the filter
- Add Relation – Another module closely related to the output module can be added to the filter as a Relation if it is necessary to use information from other than the output module in the filter’s fields or conditions. There can only be one relation per filter.
- Show to all users – Only visible to admin users. The setting makes the filter public, so it can also be used by other users.
- Share with the reporting crew – Only visible to admin users. By setting the setting on, you can choose which reporting groups the filter is distributed to.
After defining the basic information, continue from the top of the view to the Fields step.
Fields
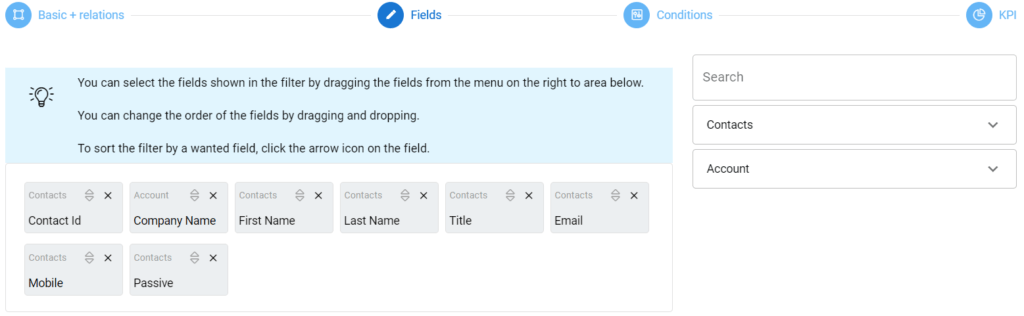
In the Fields phase, the columns of the filter are displayed and can be edited on the left-hand side of the view, right below the blue guide text area (see the picture below).
You can change the order of the columns’ fields by dragging and dropping. The filter is sorted by the desired field in either ascending or descending order by clicking the arrow icon at the top right corner of the field. You can remove the field with the X icon right next to it.
You can add new columns from the picklists at the right-hand side of the view by first clicking open the module with the desired field (the original module and a possible relation module added in the Basic + relations phase are available) and then by dragging and dropping the field to the left. You can also search for the fields with the Search field.
NOTE: It is not possible to add the same field in the filter twice. Before the 1st of February 2024 update, it was possible to edit the filter and put the same field there twice, but after the update editing, saving and using these filters as a copy to create a new one, the filters will give the user an error message. In these cases remove the duplicate fields from the filter to fix the issue.
If you want to display the entire content of the module for the fields given in this step, save the filter in this step. Otherwise, go to the Conditions tab at the top of the view.
Conditions
This is a quick guide for filter conditions. For more detailed instructions, check Filter Conditions – Complete Guide.
In this step, it is determined how the data of the fields defined in the previous step will be limited in the list view. Like in the previous phase, the field needed in a condition can be selected and dragged from the right-hand side of the view to the left-hand side. Then, depending on the field type, you can select an operator (incl. is / is not / contains, or in the case of a date field e.g. last month) and at least a suitable value.
Only mine and Only my reporting group options are an easy way to add conditions for the filter to show only the entities assigned to the user using the filter or their reporting group.
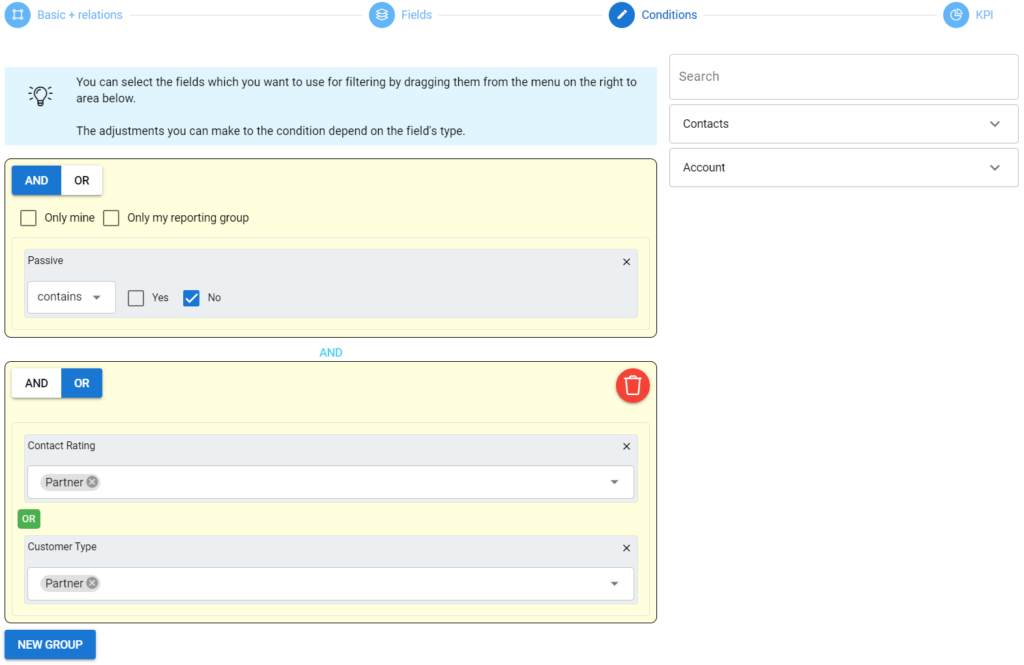
All the conditions are in AND relation with one another by default. This means that all the conditions must be met for the entity to be shown in the list. To have OR relations between the conditions, you can click the OR button at the top left corner of the condition group. If it is necessary to use both AND and OR relations, you can use the New group button to create a new condition group. This way e.g. the first group can have AND relations between the conditions and the second one OR relations (see the picture below).
After determining the conditions, you can proceed to the last phase to include KPI views in the filter. If they are not necessary, you can save the filter and start using it with the Save button.
Multi-relation
Multi-relation is created when the conditions of the filter fetch information from the module which is not the main module or relation module of the filter. Simply showing the information behind the relation module does not create multi-relation, because in that case filter is just showing the field that already exists in the card of the entity that exists in the relation module. Multi-relation is created when you create a condition that fetches information from this entity behind another entity.
Example
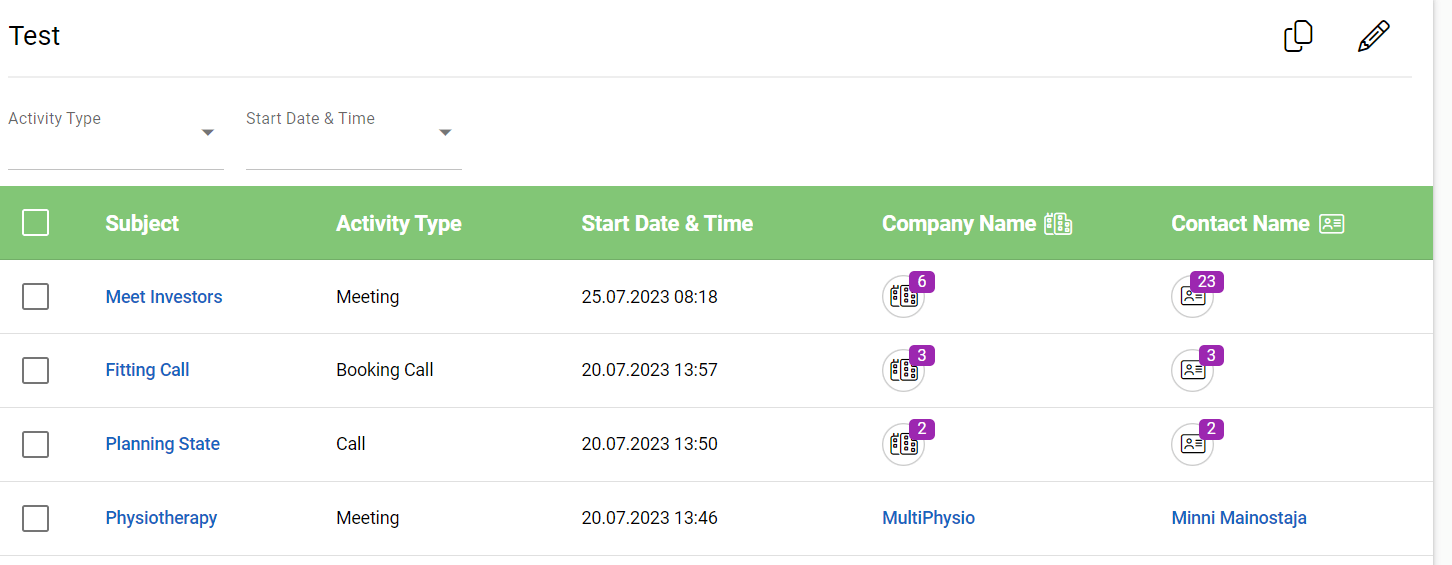
We have activities, where we have fetched the name of the activity and the person who participates in it. We have also fetched the name of the company this person belongs to. There is nothing in the filter conditions that is not readable straight from the activity card or contact card linked to it, so the list does not give an error message. In this case, the information that is fetched follows the path Activities -> Contacts.
But if we want to fetch only activities that persons from specific companies are attending, we are creating a multi-relation.
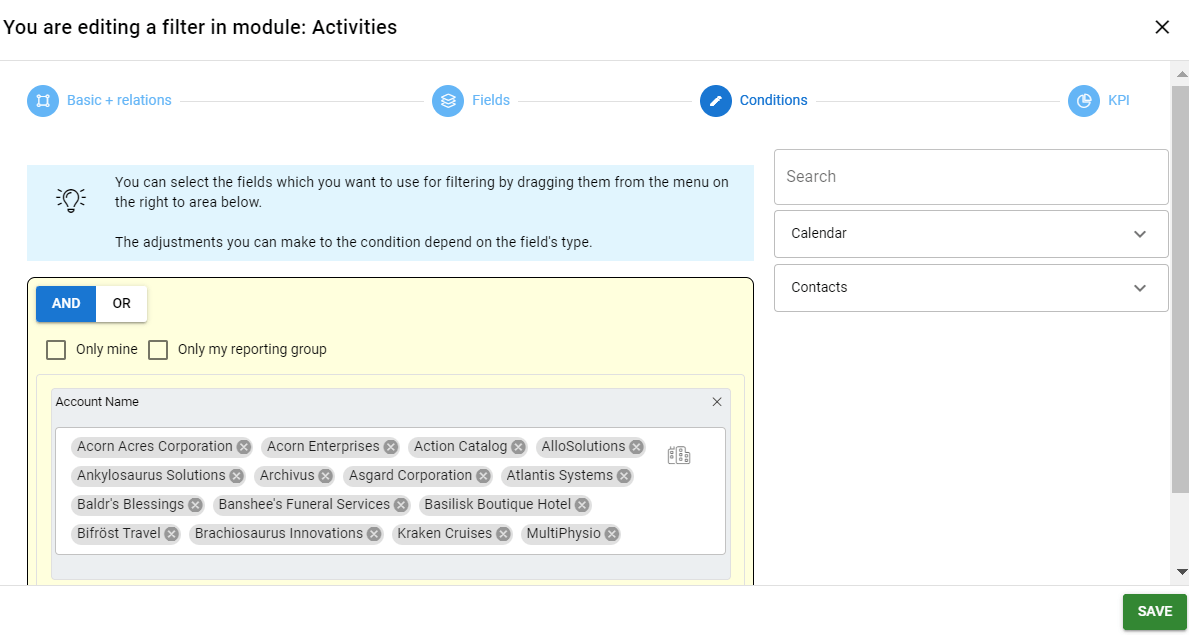
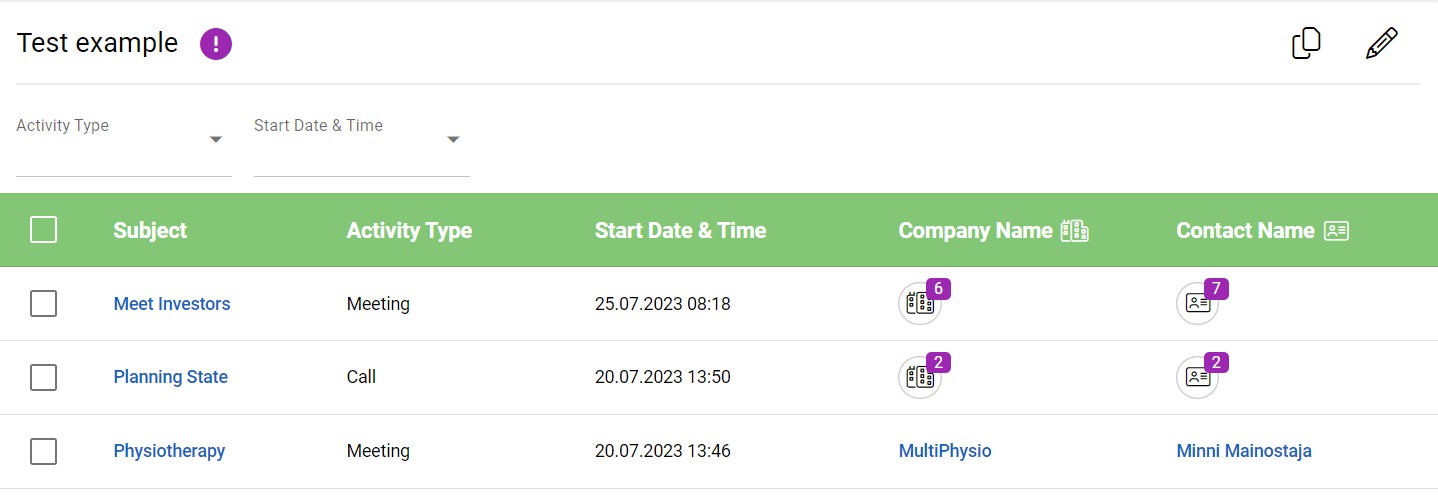
Multi-relation is created on these conditions because conditions are set to fetch information from companies, so the path information is fetched will be Activities -> Contacts – > Company. The list will show an exclamation mark next to its name to alarm the user that this list contains a multi-relation.
If it can be avoided, we do not recommend using multi-relation. The filter in this example can be made without multi-relation by making it in the Contacts module, where Activities is added as a relation. In that way the company information is fetched through the path Contacts – Company, so the multi-relation is not created.
KPI
In the optional KPI phase, you can create 1-3 KPI (Key Performance Indicator) views to be shown above the filter. These views are small summaries of the contents of the filter. At its simplest, you can have a KPI show the quantity of the entities in the filter, but it can also e.g. compare entities of a particular rating relative to the whole group or display averages or totals. Check guide about KPIs to find out more.
Filters – Frequently Asked Questions
What is a filter in the CRM?
A filter in the CRM is a tool that creates a specific list view within a module (like accounts, contacts, or invoices), determining which fields are shown, their order, and any criteria to limit the entities displayed.
Can I change the default filter?
Yes, while the default filter cannot be edited or removed, users can select a different filter to be the default by clicking the star icon next to the desired filter.
How many favorite filters can I have?
You can have up to ten favorite filters. If you try to add more, you will receive an error prompting you to remove an existing favorite.
How do I create a new filter?
To create a new filter, press the copy icon next to an existing filter, and then modify the filter template to suit your needs.
What are quick filters?
Quick filters allow you to filter data based on specific field types such as selection lists, selection boxes, or dates. They help to quickly narrow down your data in the list view.
How do I manage my filters?
You can manage your filters by clicking the “Choose Filter” button, which opens a management menu. From here, you can search for filters, access favorite and default filter options, and manage your filters (copy, edit, remove).
How do I export data from a filter view?
You can export the data displayed in the list view as an Excel file by clicking the XLS button located in the top right corner of the list view.
What is multi-relation in filter creation?
Multi-relation occurs when a filter fetches information from a module that is not the main or relation module. It requires additional conditions that link to another entity, and is indicated by an exclamation mark next to the filter name in the user interface.
How can I limit the information displayed by a filter?
You can define conditions when creating or editing a filter to limit the entities shown in the list view. Conditions can be combined using AND and OR relationships.
What are KPIs, and how can I include them in a filter?
KPIs (Key Performance Indicators) provide summaries about the data filtered by showing, for example, quantities or comparisons. You can create 1-3 KPIs while setting up your filter, providing a quick overview of the relevant metrics.
Glossary
- Export
- Convert data to a file so you can use in another software.
- Filter
- Way to show a general list view in a module, showing contents of that module as a list.
- KPI (Key Performance Indicator)
- Metric views that summarize key data points, such as totals or averages.
- Kanban
- Visualization tool that is a board with cards that are grouped into different columns. It shows data and processes in a graphical way, which helps to visualize the process.
- List view
- Displays the list of records that belong to the selected entity type in the CRM. This view is used to search, group, and filter records according to selected criteria.
- Multi-relation
- Information in the module which is not from the main module or relation module.