General
The dashboard grid view allows you to display system data in a grid format. In the grid view, data can be grouped without the need for fixed fields. In addition, calculations can be performed in the grid cells.
This guide covers the special features of the grid view. For basic information about the elements of the dashboard and how to edit them, see the guide Dashboard elements. If you want more information on managing the front page view, read the guide Editing the front page view.
Getting started
You can add a grid view to the front page view of your choice by clicking the Add new element button. Next, select the start module, after which you can filter the data to be retrieved in the Conditions tab. If you change the start module, the conditions set for the grid view will also be reset.
Quick start guide
- Go to the desired front page view and select Add new element → Grid view.
- Give the grid view a name and select the start module.
- (Optional) If you want to filter the data retrieved to the grid, set the desired conditions on the Conditions tab.
- Select the grouping field to be used for defining the time period and the time span to be used for grouping.
- Add at least one calculation field.
- (Optional) Add the desired dimension(s) to the grid.
At least one calculation field must always be added to the grid view.
The calculation fields are displayed on the left side of the grid view. If dimensions are added to the grid view, they will appear on the right side of the calculation field.
Grid view settings
- Hide total sum – This checkbox controls the visibility of the last Sum column in the grid view.
- Hide decimals – If decimals are not needed, they can be hidden with this option.
- Reverse order – Columns are displayed in reverse chronological order.
- Show total row for calculation fields – This setting allows you to add an extra row to the grid to show the sum of the calculation fields.
Example – Number of donations per month for different fundraising campaigns
Next, we will build a simple grid view showing the distribution of donations between different fundraising campaigns. In the example system, an invoice is created for each donation, and a entity is created in Payments for each paid invoice.
The start module is Invoices, and since we are only interested in donations made this year, we have set the time range to Current year in the conditions. The time is determined based on the invoice creation date. To filter out all invoices that are not donations, we have condition that the field “Fundraising target” on the invoice has value.
We want to view the results on a monthly basis, so we start by setting the grouping settings as follows:
![]()
- We select the grouping field from Payments. This way, we only include donations that have been paid.
- We select the Payment date field as the field to be used for grouping.
- Since we want the results on a monthly basis, we select the value Month from the Group by menu.
However, no data is yet visible in the grid, as we need a calculation field for this. We set the following conditions for the calculation view:

- We select Payments as the module.
- We select Payment amount as the field.
- The Sum selection calculates the total amount of all payments.
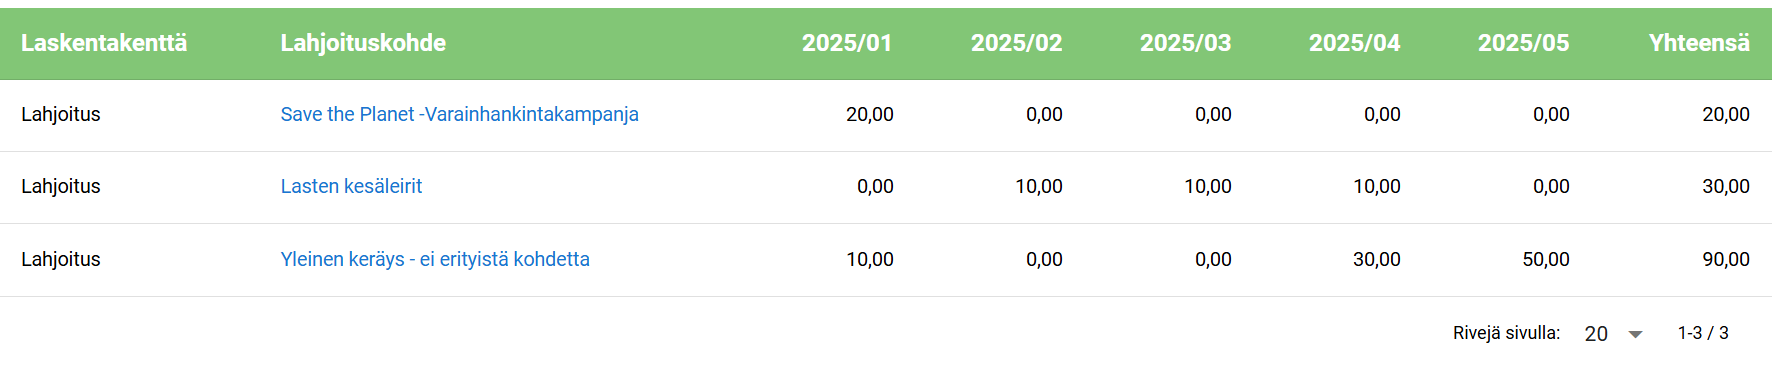
Now we have a calculation field with the heading Donation. If we update the preview view, we can see that a sum has now appeared under each month of 2025, telling us how much we have received in payments during that month and how much has accumulated in total.
However, we want more detailed information on how the payments are distributed among the desired donation campaigns. For this purpose, the example system has a field called Donation target in the Invoices module. We therefore make the following dimension settings:
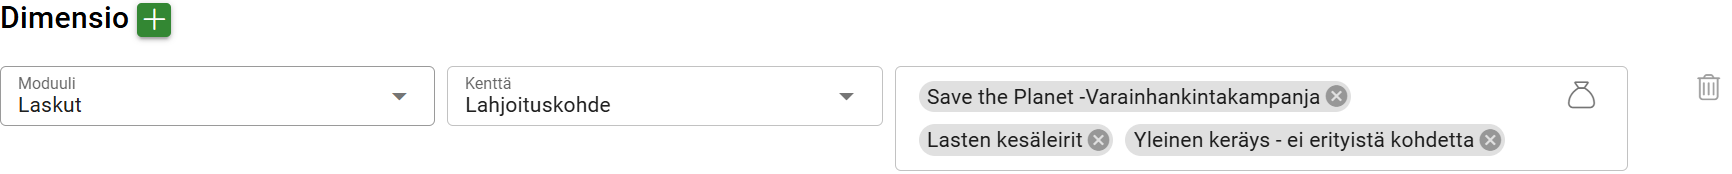
- Select Invoices as the module
- Select Donation target as the field
- Finally, select the desired donation campaigns – in this example we have three.
The last field can also be left blank, in which case the grid will show all donation campaigns that have received payments during the current year.
With these conditions, we get the following grid view:
Example – Number of donations from outside the organisation per month for different donation recipients
In the second example, we want a similar grid view, but our intention is to only view the number of donations received from outside the association. We start by creating a grid view as in the example above, after which we exclude our association members using the Conditions tab. In our example, we use the Membership field in the Contacts module to search for donors who do not belong to the association via the Conditions tab as follows:
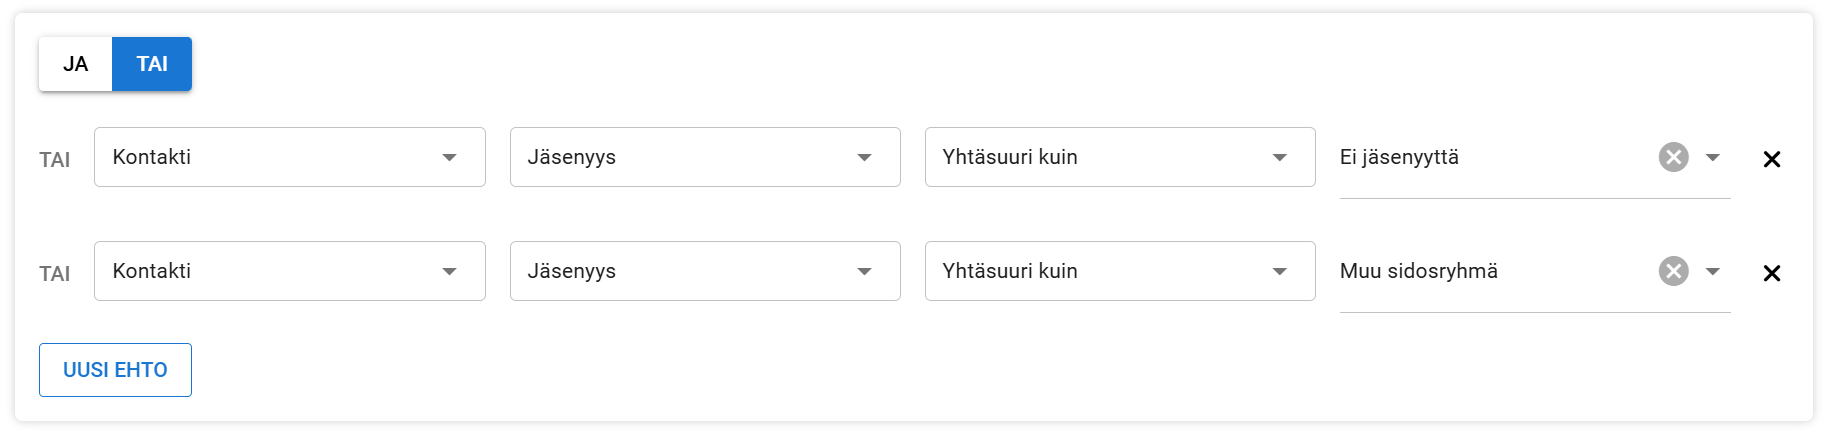
- We set the OR condition that Membership is Equal to No membership
- We set a second OR condition that Membership is Equal to Other stakeholders.
The other options in the Membership field relate to different membership types in the example system, so the above conditions filter out all other membership types from the grid. The OR condition is used because the Membership field can only have one value, so using the AND condition would result in an empty list.
After adding the conditions, the grid view of the first example changes according to the conditions and looks like this:
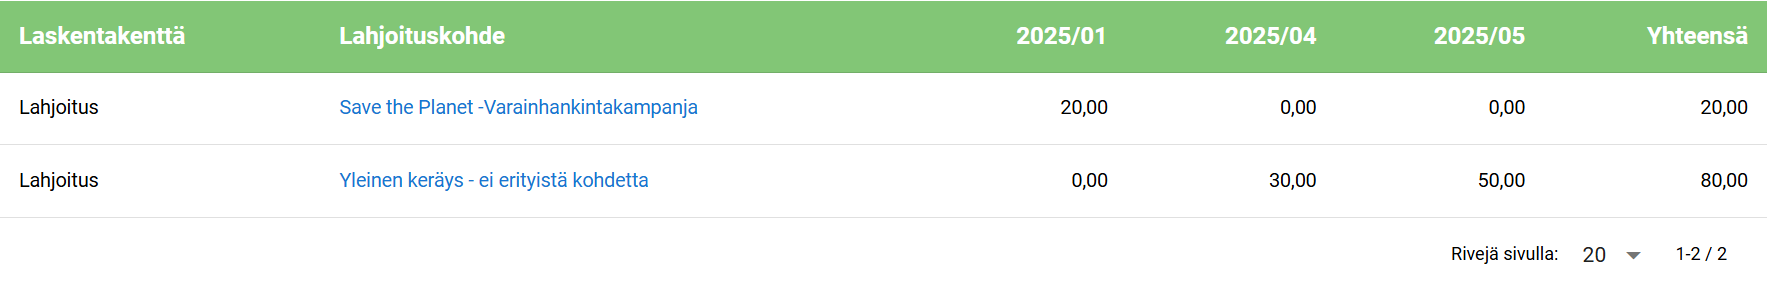
As you can see in the picture above, when viewing grid views, it is good to note that completely empty columns and rows are not displayed. For example, there were no external donations for Children’s Summer Camps in 2025, so this dimension row has been removed from the view. In addition, there were no external donations in February-March, so the April column 2025/04 is displayed after the January column 2025/01.