Viewing and Sharing Reports
The report generator can be used to create reports that combine information from different modules. The reports help you get a hold of the CRM data and provide material to base decisions on.
The created reports can be viewed directly in a browser (a new tab will be opened) by clicking on a report on the front page of the report generator. The reports can also be exported in Excel or CVS format. The Adjust button can be activated for each report and it can be used to alter the conditions of the report (for example the time span) easily in the front page view, without having to edit the report itself.
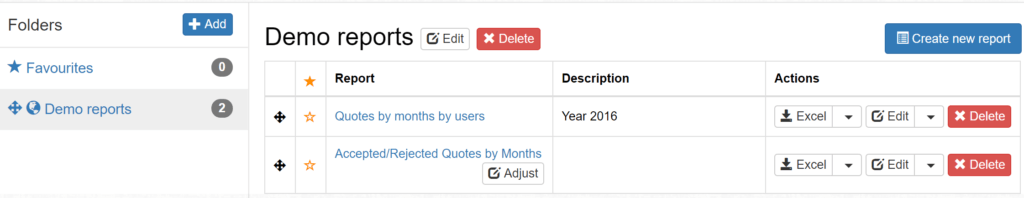
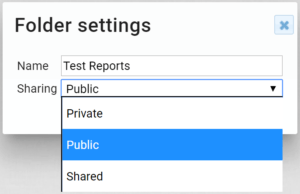
You can create different folders and sort the reports to them. The folder can be set private, shared or public (see the picture below). A shared folder can be specified to be visible/usable for certain users and/or sales organisations only. These settings can be edited afterwards. Reports can also be moved from one folder to another.
The most important reports can be marked with a star as a favorite and they will then appear in the Favorites folder.
Creating a New Report
To create a new report, a folder must be chosen first. If there are no folders available, a new folder has to be created.
The only compulsory information for a report is the Source module(s), whose data will be used in the report. This/these module(s) are determined on the From tab. All the other settings are voluntary (the more detailed specifications and conditions are set, the more precise the report will be).
NOTE: Remember to always save the changes made to the report by clicking the Save button at the bottom right corner of the Settings tab!
More information about the tabs and their functions is presented below.
From
The From tab is used to specify the source module(s). The Add relation button is used to form relations between the source module and another module (for example the report lists quotes, to which a account has been linked, to which a contact has been linked – see the picture above). If two or more modules are added as relations to the source module, these two linked modules interact only with the source module but not with each other (see the picture below).
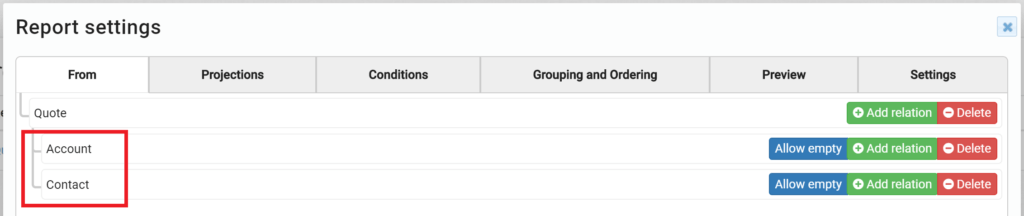
The Allow empty button is used to determine whether or not empty relations are allowed (e.g. if the contacts relation is allowed to be empty, the report will show also quotes that have no contacts related to them). When the button is blue, it does not allow empty relations; when it is green, it allows them.
Projections
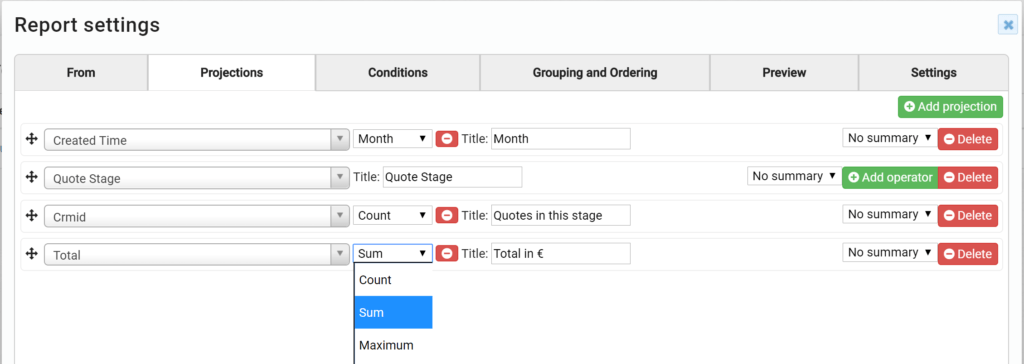
The Projections tab is used for choosing the fields that determine the information shown on the report. The order of the fields in the report can easily be modified by dragging. An operator can be added to each field: count, sum, maximum, average, minimum, year, quarter, month, week, day, time or hour. The chosen operator(s) determine how the field’s content will be shown in the report. The operators available vary by the field type:
- Text- ja CRM-ID fields can only be used with count operator
- Date field can be used with the operators year, month, quarter, week, time and hour
- In numeric fields the following operators can be used: counts, sum, average, maximum and minimum
- If no operator is chosen, the report will show only the content of the field.
Additionally, you can choose whether the information in the summary of the fields is based on count, average, minimum or maximum or no summary is wanted at all (No summary).
The fields added will be used as columns in the report. The header of each column is the field name by default, but you can also use a custom header by writing the header in the As field.
Conditions
The Conditions have the same logic as the conditions in the module Target Groups. The information shown in the report can be further defined with AND and OR conditions (AND being the default value). The conditions can also be grouped. The grouping function clarifies the hierarchy of the conditions (see the picture below – this report lists all the quotes from the beginning of 2017 that were either accepted or rejected with a price over 2000€).
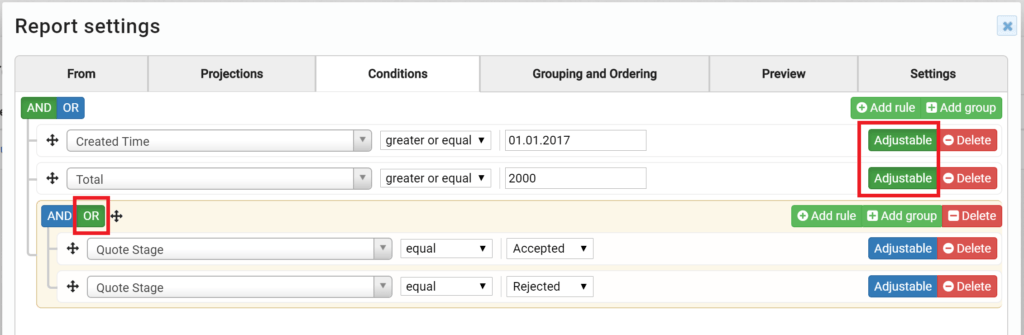
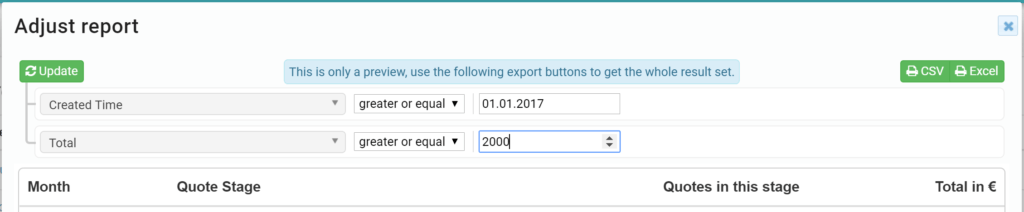
When the Adjustable button is activated (turns green), the chosen conditions can be edited straight from the front page view by clicking the Adjust button of the report (in the pictures above and below the Created Time and the Total of the quotes can be adjusted). This function updates only the data in the opened report view, it does not make any changes to the original report (see the picture below).
Grouping and Ordering
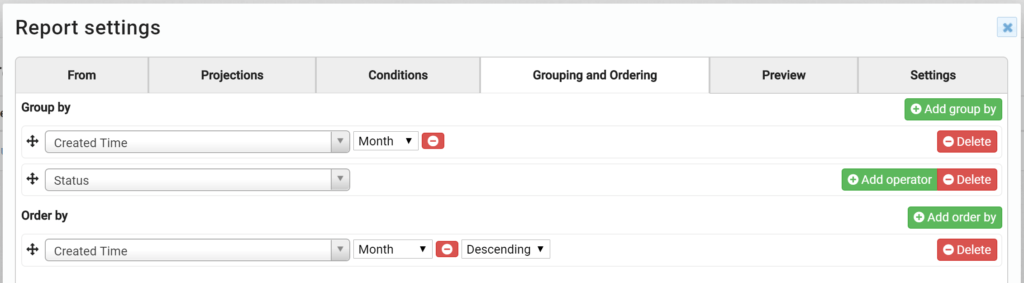
The Grouping function bundles all the information that meet the set condition into one row on the report (e.g. all the quotes created during the same month. In the picture below, they are also grouped by their stage).
The Ordering function determines in which order the rows of the report are shown: for example the rows are aligned by month and sum from top to bottom. This means that the report would show first all the quotes made in December (in both stages separately), and then the ones made in November and so on.
Preview
On the Preview tab, the created report and its results can be previewed.
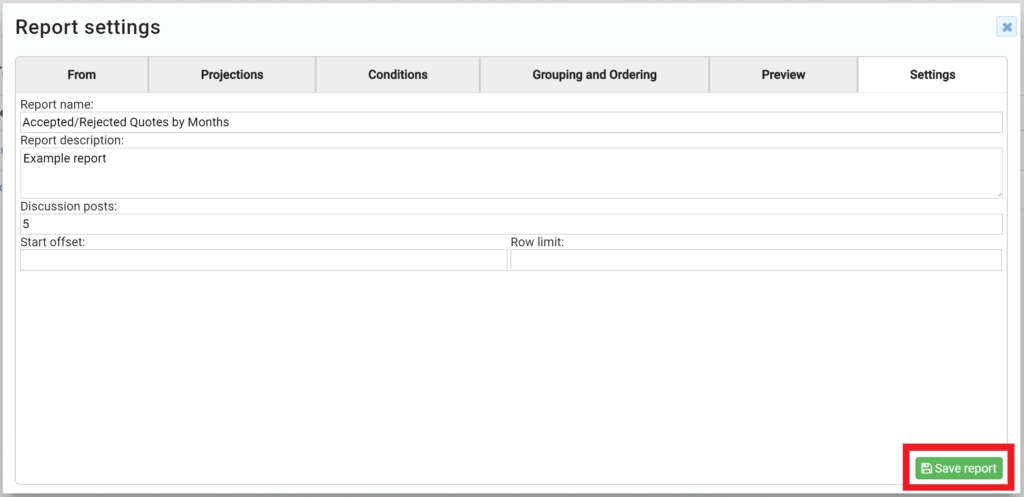
Settings
On the Settings tab, the name and description of the report can be edited (also for a previously created one). Also the reports starting row can be set through this tab as well as how many rows will be shown on the report (e.g. show only the top10). The report is saved on this tab by clicking the Save report button at the bottom right corner (see the picture below).